 Facebook
 Twitter
 Pinterest
 Copy Link
Local Market Update – May 2020

We hope you are weathering the new normal as best as you can. With everyone spending more time than ever at home, real estate has taken on a whole new importance. For those who are interested, here is a brief update on how COVID-19 continues to affect our local market:
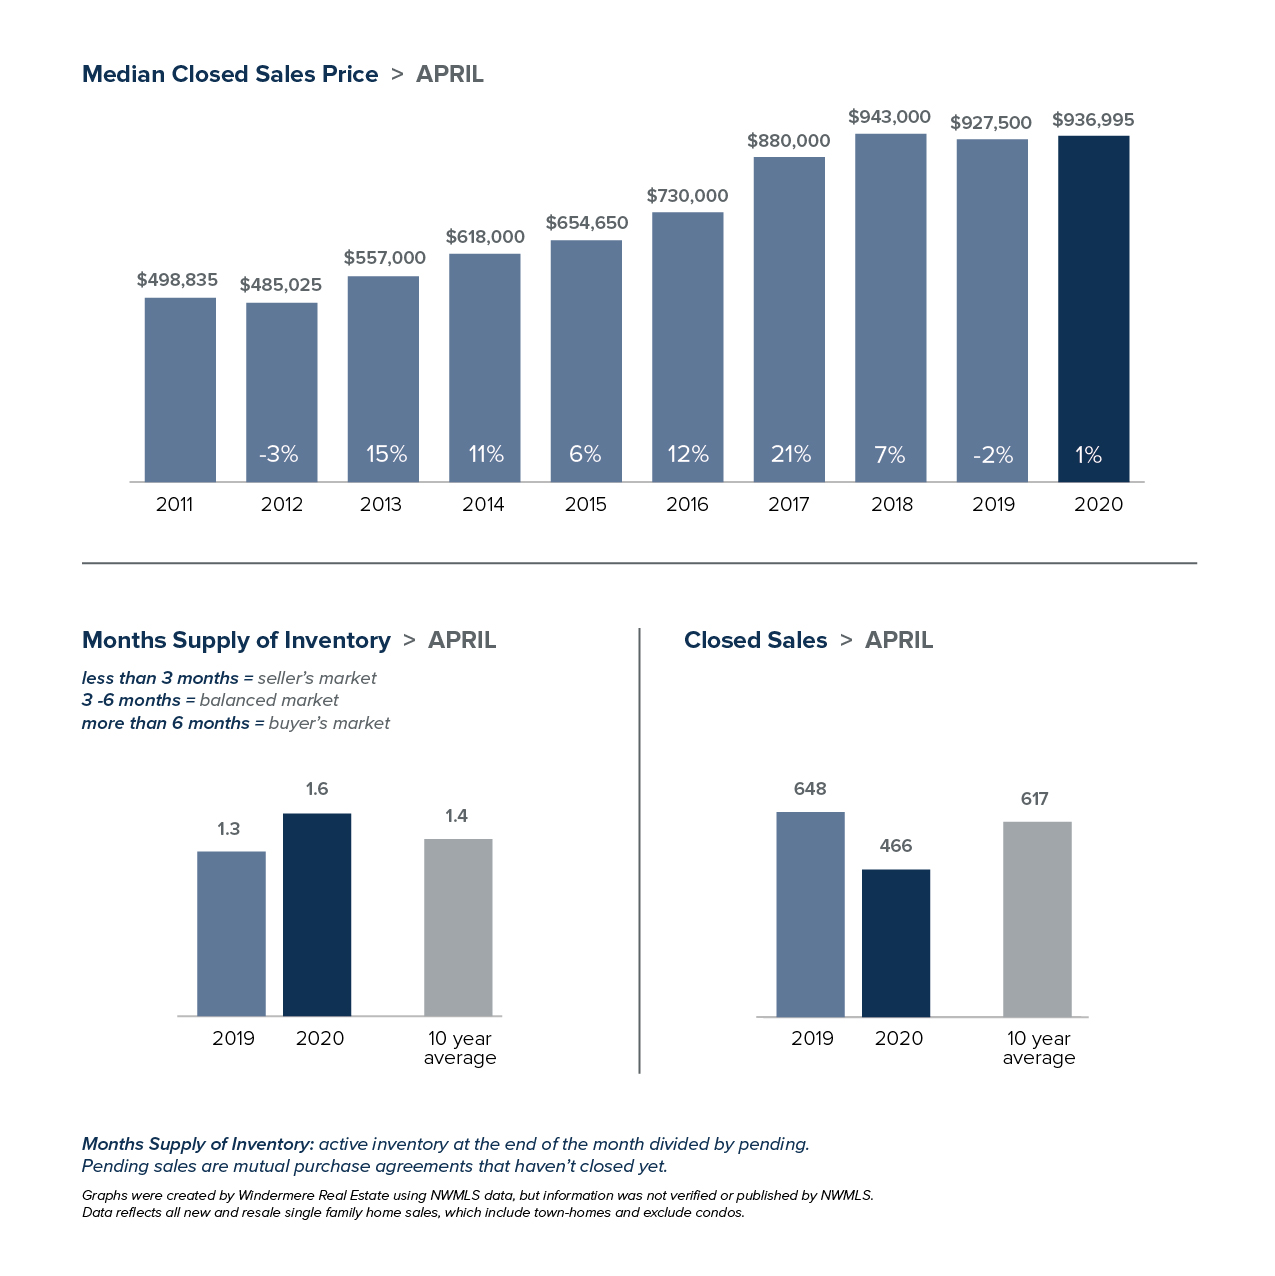
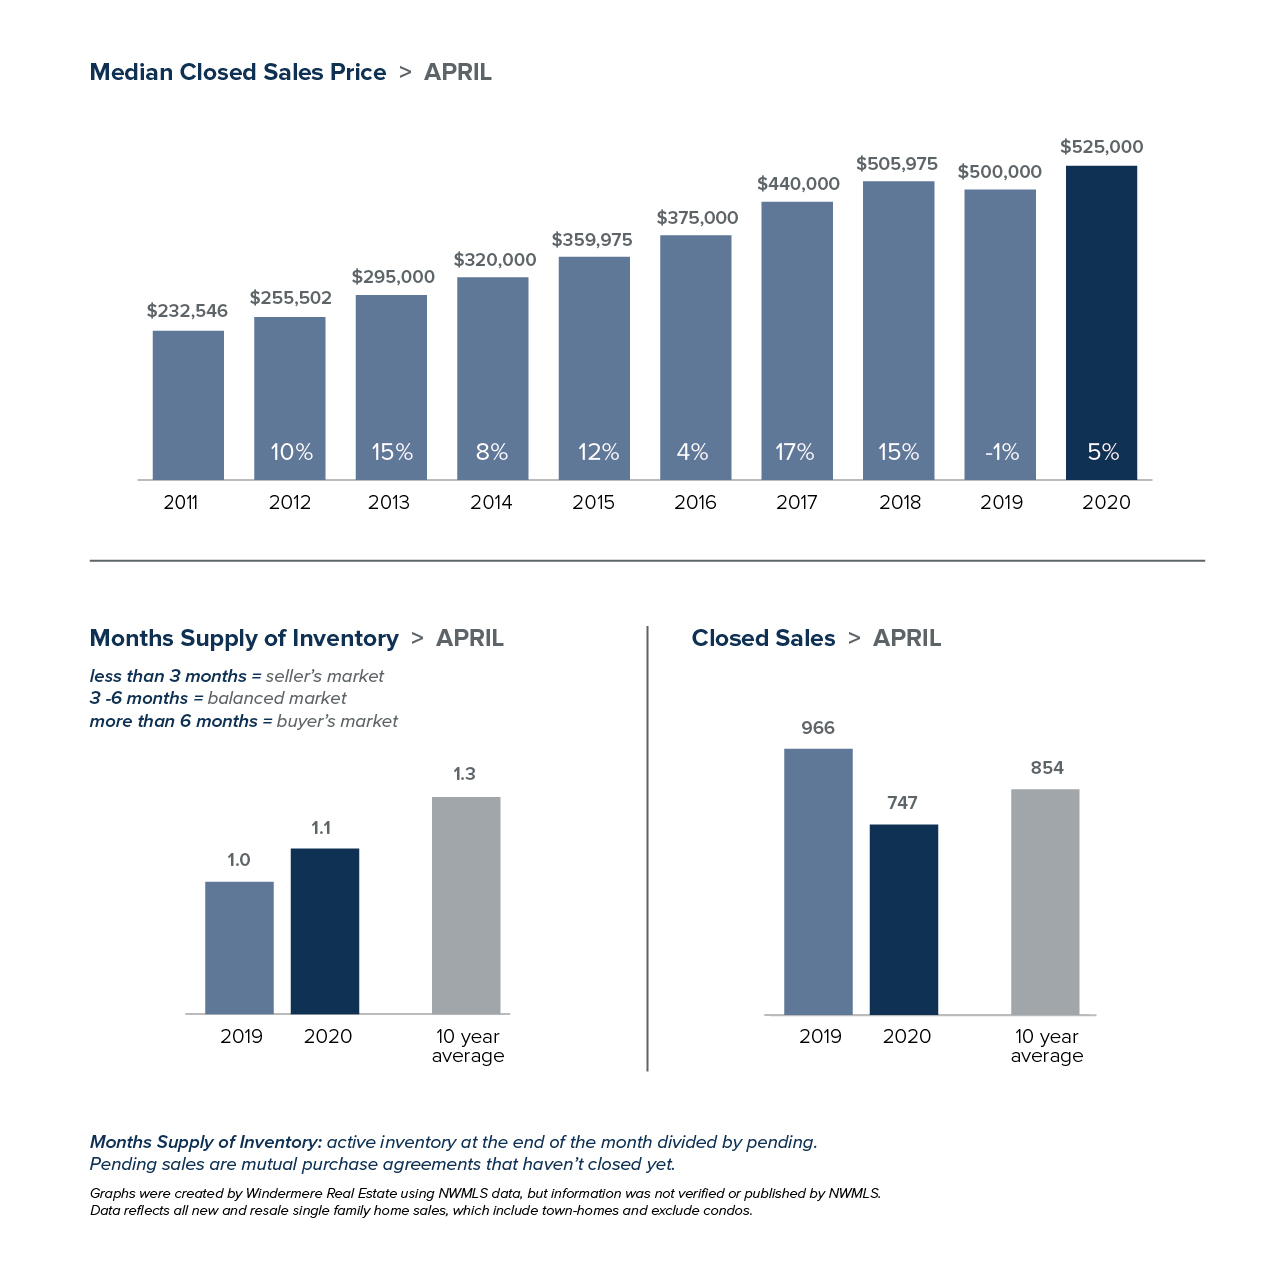
- Business was better than expected under the Stay Home order. COVID-19 did reduce real estate sales in April as compared to a year ago, however the number of sales rose steadily each week of the month. Sales growth continued in early May and we expect sales to increase slowly week by week.
- The number of new listings dropped, suggesting that would-be sellers are waiting until the shelter-in-place order is over to put their home on the market. With local technology companies continuing to hire, buyers will continue to face competition for limited inventory in the coming months.
- Home prices remain stable, with the median price of homes sold in April up slightly from a year ago. Sellers appear to be pricing homes realistically and buyers are not finding deep discounts.
The monthly statistics below are based on closed sales. Since closing generally takes 30 days, the statistics for April are mostly reflective of sales in March. Next month’s data will offer a more telling trend of the effect of the virus on the local housing market.
If you are interested in more information, every Monday Windermere Chief Economist Matthew Gardner provides an update regarding the impact of COVID-19 on the US economy and housing market. You can get Matthew’s latest update here.
As our current situation evolves, know that the safety of everyone remains our top priority.
EASTSIDE
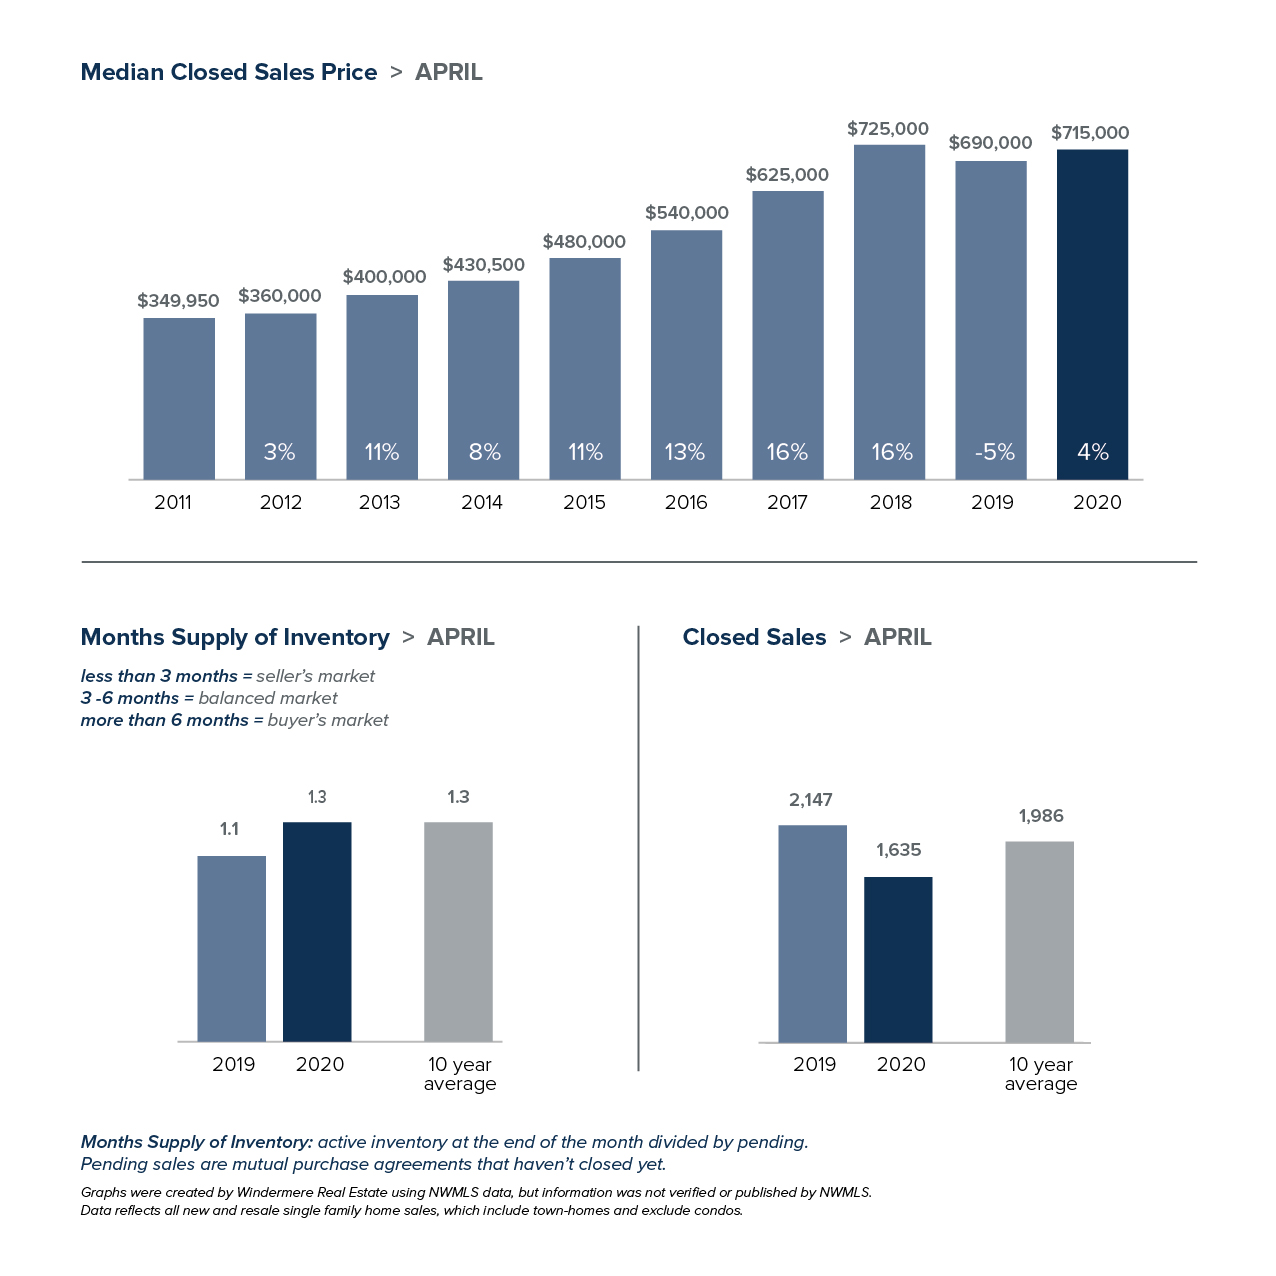
KING COUNTY
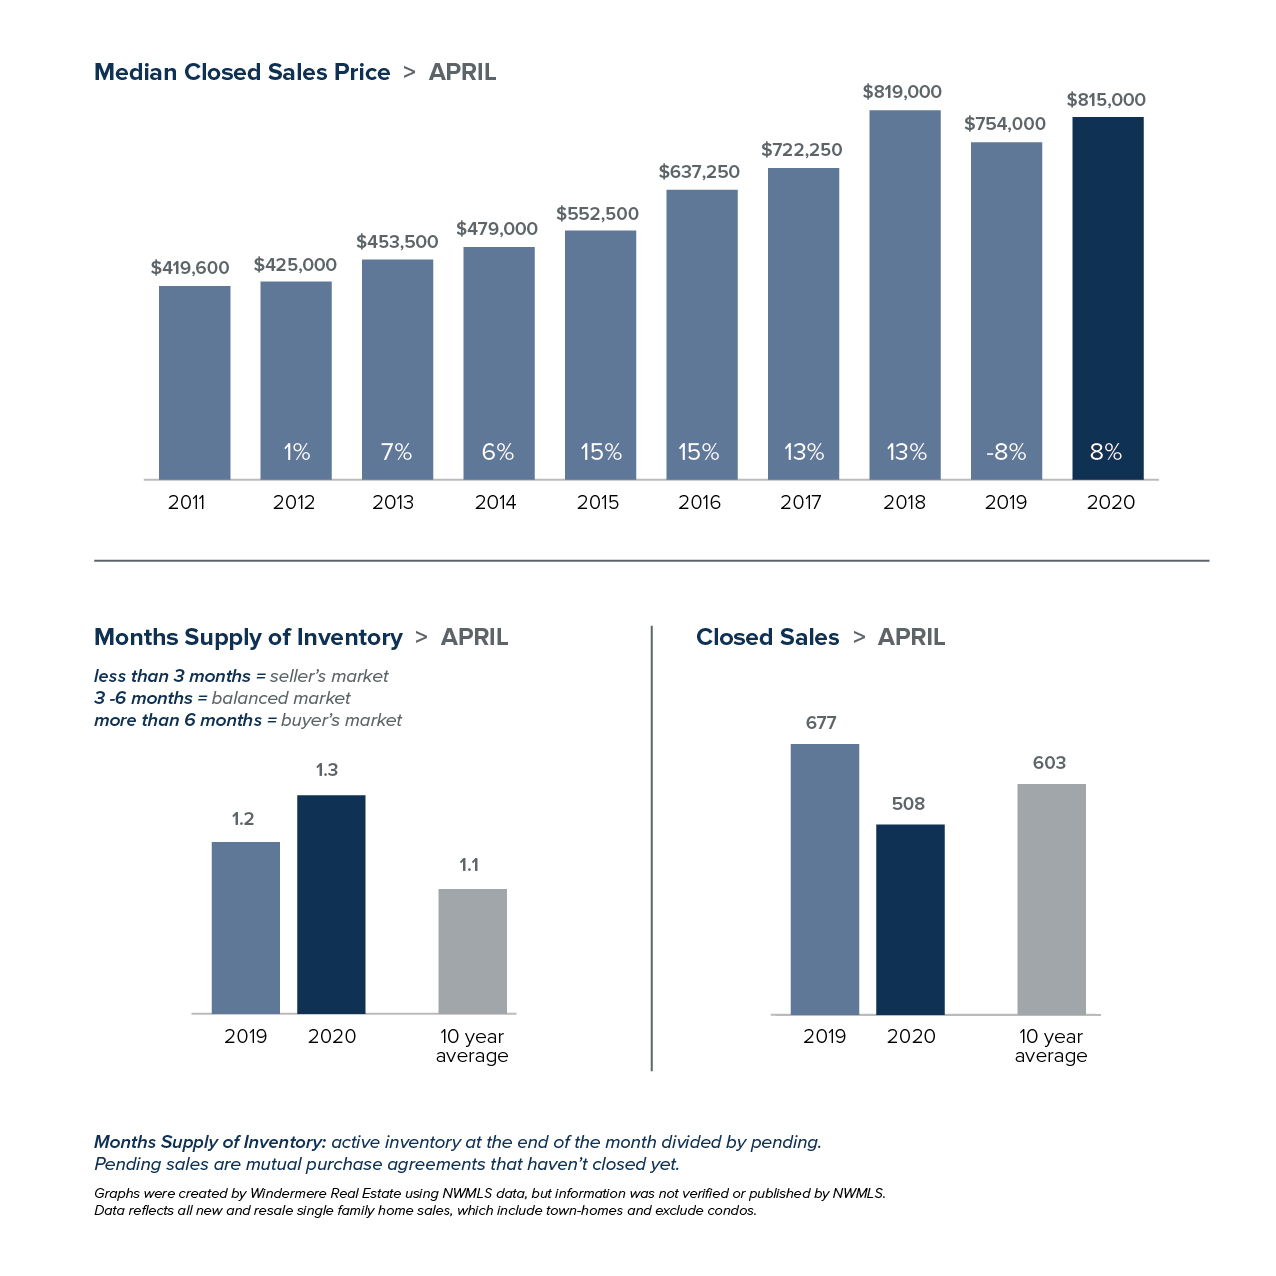
SEATTLE
SNOHOMISH COUNTY
VIEW FULL SNOHOMISH COUNTY REPORT
This post originally appeared on GetTheWReport.com
Local Market Update – March 2020
The novel coronavirus (COVID-19) has not yet dampened demand in the housing market. Traffic at open houses remains heavy. Buyers who had waited last year for a drop in prices have now seen several months of home prices increases. With demand far outstripping supply and record low interest rates, the market heading into spring looks hotter than ever.
EASTSIDE
Buyers that may have been in wait-and-see mode at the end of 2019 jumped off the fence in February. Pending sales (offers accepted but not yet closed) jumped 27%, snapping up already-tight inventory. 55% of homes on the market sold in 15 days or less. The median home price jumped 9% over a year ago to $985,000, an increase of $58,000 from the prior month. Development on the Eastside continues to surge and includes the recent groundbreaking for a 600-foot tower in Bellevue and a proposed 11-acre mixed-use project.
KING COUNTY
The tight housing market here got even tighter. There were 40% fewer homes on the market in King County in February than there were in January. The median home price rose 3% over the prior year to $675,000, up from $630,525 in January. With mortgage rates and the local unemployment rate both hitting record lows, demand isn’t likely to drop any time soon.
SEATTLE
With just six weeks of available inventory, competition for homes in Seattle remains fierce. Multiple offers were the norm, and 34% of homes purchased in February sold for over the listing price. The median price for a single-family home in February was $730,500, unchanged from a year ago and up from $719,950 in January.
SNOHOMISH COUNTY
The numbers in Snohomish County tell the story. There were 42% fewer listings in February than a year ago, and 42% more pending sales. With inventory at under a month of supply, there just aren’t enough homes to meet demand. That scarcity translated into higher prices, with the median price of a single-family home rising 8% over a year ago to $515,000.

VIEW FULL SNOHOMISH COUNTY REPORT
This post originally appeared on GetTheWReport.com
Local Market Update – February 2020

New jobs and low interest rates continue to fuel the housing market boom. While January is traditionally a slower month for activity, the new year saw steady buyer demand. With the number of sales exceeding new listings, all indicators point to a strong spring market.
EASTSIDE
The tech industry on the Eastside continues to grow rapidly. Microsoft and Alibaba both have significant expansions underway. Amazon expects to increase its workforce in Bellevue to 15,000 in the next few years, a sevenfold increase from today. As the economy continues to grow, inventory keeps being squeezed. There were 47% fewer single-family homes on the market in January than the year prior. Home prices have been stabilizing for some time, fluctuating slightly from month to month. In January the median home price slipped 2% over a year ago to $892,000.

KING COUNTY
The number of single-family homes on the market in King County was down nearly 44% from a year ago. That lack of inventory has resulted in more multiple offers and the return of review dates, where sellers identify a date to review all offers. Strong competition for a small supply of homes boosted the median home price 3% over the prior year to $630,525.

SEATTLE
The jobs outlook in Seattle for 2020 remains robust, and demand for homes continues to outstrip supply. Traffic at open houses in January reflected that demand, with one central Seattle homes priced in the $1.2 million range drawing more than 300 visitors. Home prices in the city have been relatively stable for the past 12 months. That remained the case in January where the median price for a single-family home inched up 1% over last year to $719,950.

SNOHOMISH COUNTY
With 35% less inventory than last January, competition among buyers in Snohomish County is fierce and multiple offers have become the norm. The median price of a single-family home soared 12% over a year ago to $509,950. Home prices have been playing catch up, increasing at a much faster pace over the past year than King County. While the prices gap has closed, the median price here is still nearly 20% less than King County.

VIEW FULL SNOHOMISH COUNTY REPORT
This post originally appeared on GetTheWReport.com
Western Washington Real Estate Market Update – Q3 2019

The following analysis of the Western Washington real estate market is provided by Windermere Real Estate Chief Economist, Matthew Gardner. We hope that this information may assist you with making better-informed real estate decisions. For further information about the housing market in your area, please don’t hesitate to contact me!
ECONOMIC OVERVIEW
Washington State employment has softened slightly to an annual growth rate of 2%, which is still a respectable number compared to other West Coast states and the country as a whole. In all, I expect that Washington will continue to add jobs at a reasonable rate though it is clear that businesses are starting to feel the effects of the trade war with China and this is impacting hiring practices. The state unemployment rate was 4.6%, marginally higher than the 4.4% level of a year ago. My most recent economic forecast suggests that statewide job growth in 2019 will rise by 2.2%, with a total of 88,400 new jobs created.
HOME SALES
- There were 22,685 home sales during the third quarter of 2019, representing a slight increase of 0.8% from the same period in 2018 and essentially at the same level as in the second quarter.
- Listing activity — which rose substantially from the middle of last year — appears to have settled down. This is likely to slow sales as there is less choice in the market.
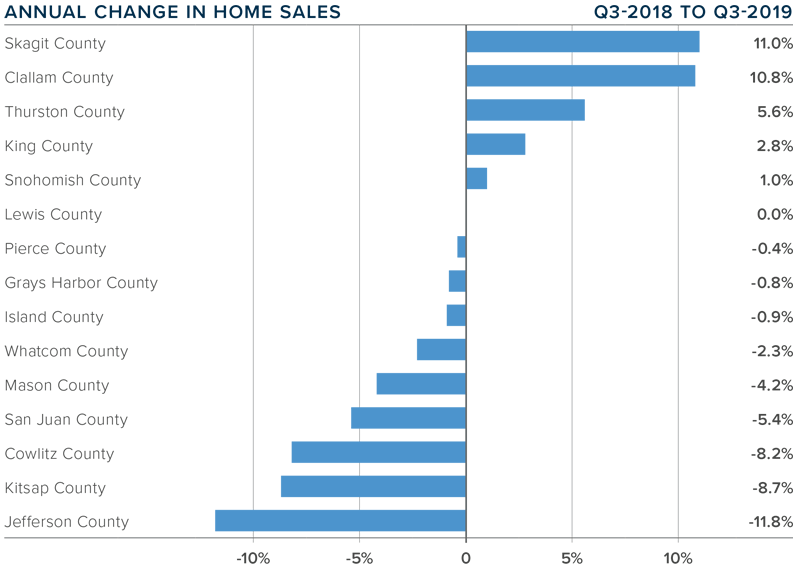
- Compared to the third quarter of 2018, sales rose in five counties, remained static in one, and dropped in nine. The greatest growth was in Skagit and Clallam counties. Jefferson, Kitsap, and Cowlitz counties experienced significant declines.
- The average number of homes for sale rose 11% between the second and third quarters. However, inventory is 14% lower than in the same quarter of 2018. In fact, no county contained in this report had more homes for sale in the third quarter than a year ago.
HOME PRICES
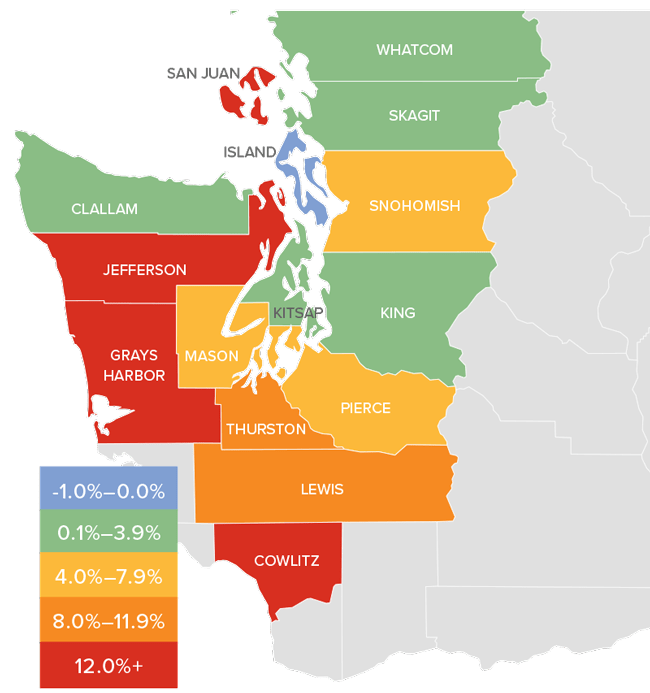
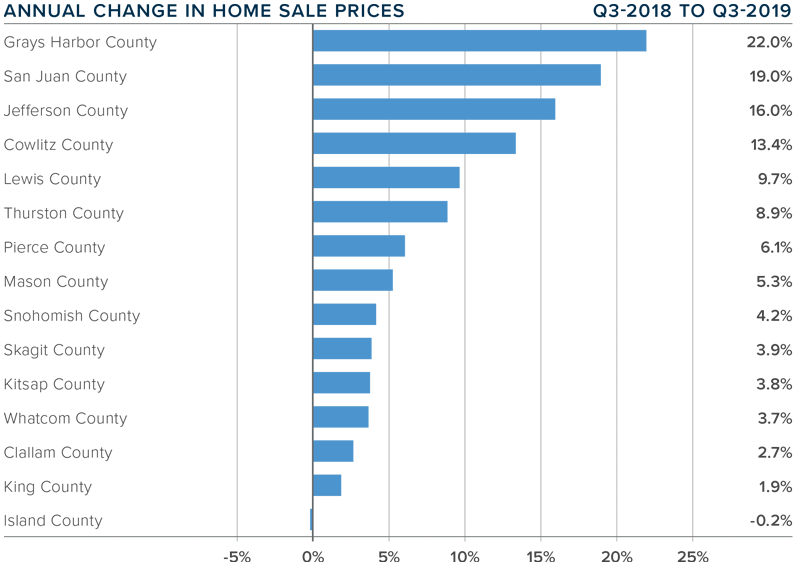
- Home price growth in Western Washington notched a little higher in the third quarter, with average prices 4.2% higher than a year ago. The average sales price in Western Washington was $523,016. It is worth noting, though, that prices were down 3.3% compared to the second quarter of this year.
- Home prices were higher in every county except Island, though the decline there was very small.
- When compared to the same period a year ago, price growth was strongest in Grays Harbor County, where home prices were up 22%. San Juan, Jefferson, and Cowlitz counties also saw double-digit price increases.
- Affordability issues are driving buyers further out which is resulting in above-average price growth in outlying markets. I expect home prices to continue appreciating as we move through 2020, but the pace of growth will continue to slow.
DAYS ON MARKET
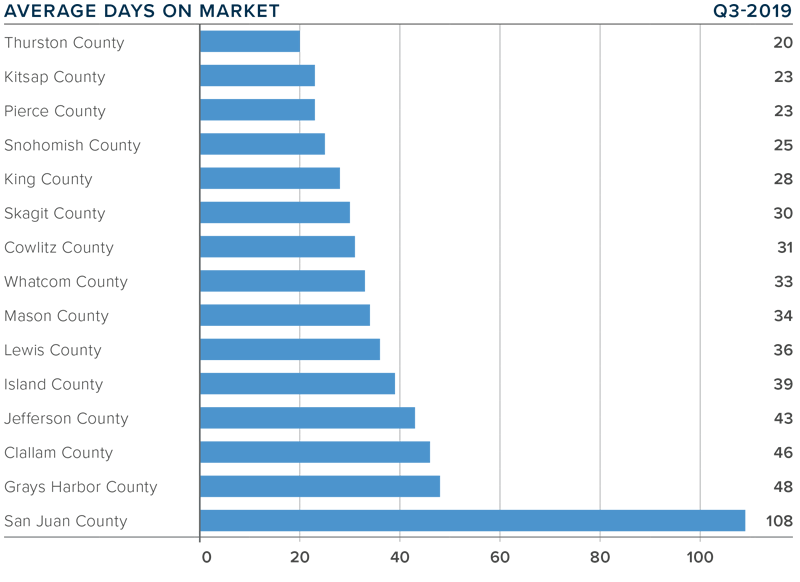
- The average number of days it took to sell a home dropped one day when compared to the third quarter of 2018.
- Thurston County was the tightest market in Western Washington, with homes taking an average of only 20 days to sell. There were six counties where the length of time it took to sell a home dropped compared to the same period a year ago. Market time rose in six counties, while two counties were unchanged.
- Across the entire region, it took an average of 38 days to sell a home in the third quarter. This was down 3 days compared to the second quarter of this year.
- Market time remains below the long-term average across the region and this trend is likely to continue until more inventory comes to market, which I do not expect will happen until next spring.
CONCLUSIONS

This speedometer reflects the state of the region’s real estate market using housing inventory, price gains, home sales, interest rates, and larger economic factors. I am leaving the needle in the same position as the first and second quarters, as demand appears to still be strong.
The market continues to benefit from low mortgage rates. The average 30-year fixed rates is currently around 3.6% and is unlikely to rise significantly anytime soon. Even as borrowing costs remain very competitive, it’s clear buyers are not necessarily jumping at any home that comes on the market. Although it’s still a sellers’ market, buyers have become increasingly price-conscious which is reflected in slowing home price growth.

As Chief Economist for Windermere Real Estate, Matthew Gardner is responsible for analyzing and interpreting economic data and its impact on the real estate market on both a local and national level. Matthew has over 30 years of professional experience both in the U.S. and U.K.
In addition to his day-to-day responsibilities, Matthew sits on the Washington State Governors Council of Economic Advisors; chairs the Board of Trustees at the Washington Center for Real Estate Research at the University of Washington; and is an Advisory Board Member at the Runstad Center for Real Estate Studies at the University of Washington where he also lectures in real estate economics.
This post originally appeared on the Windermere.com Blog.
The Gardner Report | Q2 2019 – Western Washington


The following analysis of the Western Washington real estate market is provided by Windermere Real Estate Chief Economist Matthew Gardner. I hope that this information may assist you with making better-informed real estate decisions. For further information about the housing market in your area, please don’t hesitate to contact me.
Economic Overview
Washington State employment jumped back up to an annual growth rate of 2.4% following a disappointing slowdown earlier in the spring. As stated in the first quarter Gardner Report, the dismal numbers earlier this year were a function of the state re-benchmarking its data (which they do annually).
The state unemployment rate was 4.7%, marginally up from 4.5% a year ago. My current economic forecast suggests that statewide job growth in 2019 will rise by 2.6%, with a total of 87,500 new jobs created.
Home Sales Activity
- There were 22,281 home sales during the second quarter of 2019, representing a drop of 4.8% from the same period in 2018. On a more positive note, sales jumped 67.6% compared to the first quarter of this year.
- Since the middle of last year, there has been a rapid rise in the number of homes for sale, which is likely the reason sales have slowed. More choice means buyers can be more selective and take their time when choosing a home to buy.
- Compared to the second quarter of 2018, there were fewer sales in all counties except Whatcom and Lewis. The greatest declines were in Clallam, San Juan, and Jefferson counties.
- Listings rose 19% compared to the second quarter of 2018, but there are still a number of very tight markets where inventory levels are lower than a year ago. Generally, these are the smaller — and more affordable — markets, which suggests that affordability remains an issue.

Home Prices
-

Year-over-year price growth in Western Washington continues to taper. The average home price during second quarter was $540,781, which is 2.8% higher than a year ago. When compared to first quarter of this year, prices were up 12%.
- Home prices were higher in every county except King, which is unsurprising given the cost of homes in that area. Even though King County is home to the majority of jobs in the region, housing is out of reach for many and I anticipate that this will continue to act as a drag on price growth.
- When compared to the same period a year ago, price growth was strongest in Lewis County, where home prices were up 15.9%. Double-digit price increases were also seen in Mason, Cowlitz, Grays Harbor, and Skagit counties.
- The region’s economy remains robust, which should be a positive influence on price growth. That said, affordability issues are pervasive and will act as a headwind through the balance of the year, especially in those markets that are close to job centers. This will likely force some buyers to look further afield when searching for a new home.

Days on Market
- The average number of days it took to sell a home matched the second quarter of 2018.
- Snohomish County was the tightest market in Western Washington, with homes taking an average of only 21 days to sell. There were five counties where the length of time it took to sell a home dropped compared to the same period a year ago. Market time rose in eight counties and two were unchanged.
- Across the entire region, it took an average of 41 days to sell a home in the second quarter of 2019. This was the same as a year ago but is down 20 days compared to the first quarter of 2019.
- As stated above, days-on-market dropped as we moved through the spring, but all markets are not equal. I suggest that this is not too much of an issue and that well-priced homes will continue to attract attention and sell fairly rapidly.

Conclusions


