The following analysis of the Western Washington real estate market is provided by Windermere Real Estate Chief Economist Matthew Gardner. We hope that this information may assist you with making better-informed real estate decisions. For further information about the housing market in your area, please don’t hesitate to contact me!
REGIONAL ECONOMIC OVERVIEW
In the summer and fall of 2020, Western Washington regained some of the jobs lost due to COVID-19, but employment levels in the region have been in a holding pattern ever since. As of February, the region had recovered 132,000 of the 297,000 jobs that were lost, but that still leaves the area down by 165,000 positions. Given the announcement that several counties may have to roll back to phase 2 of reopening, I would not be surprised to see businesses hold off on plans to add to their payrolls until the picture becomes clearer. Even with this “pause” in the job recovery, the region’s unemployment rate ticked down to 6.1% from the December rate of 6.4% (re-benchmarking in 2020 showed the December rate was higher than the originally reported 5.5%). The lowest rate was in King County (5.3%) and the highest rate was in Grays Harbor County, which registered at 9.2%. Despite the adjustment to the 2020 numbers, my forecast still calls for employment levels to increase as we move through the year, though the recovery will be slower in areas where COVID-19 infection rates remain elevated.
WESTERN WASHINGTON HOME SALES
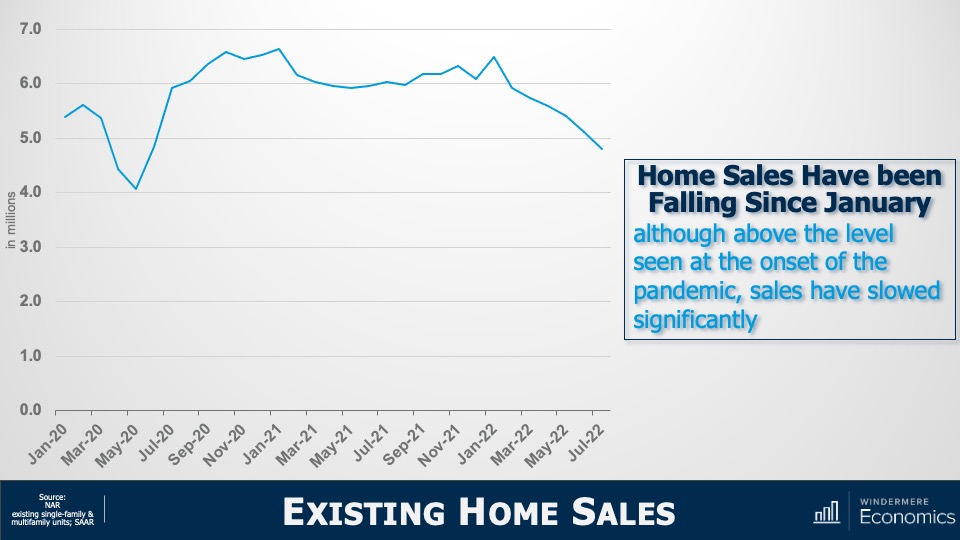
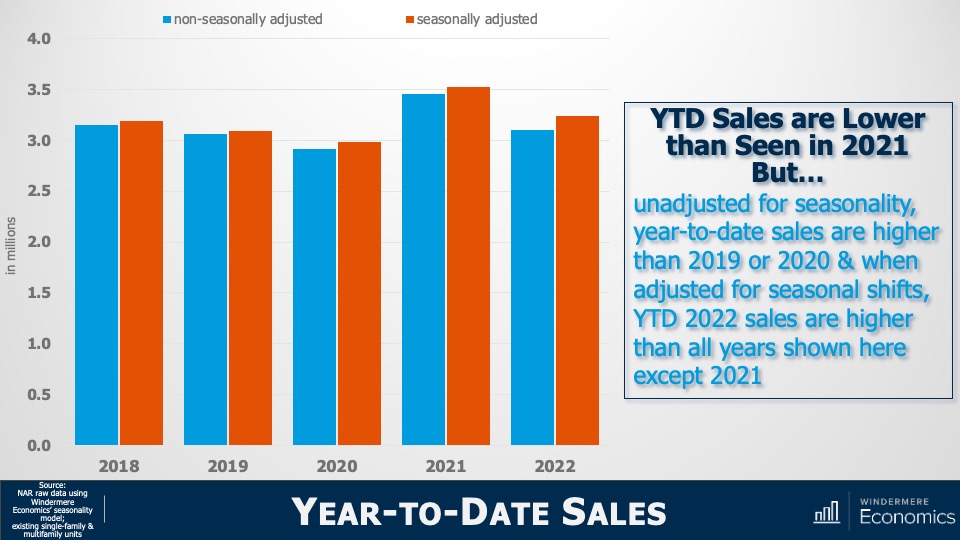
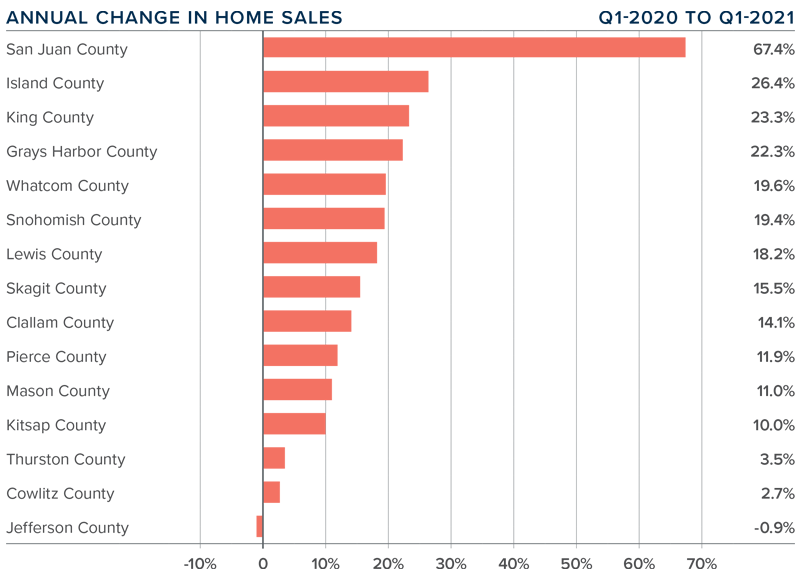
❱ Sales in the first quarter were impressive, with 15,893 home sales. This is an increase of 17.5% from the same period in 2020, but 32% lower than in the final quarter of last year—a function of low levels of inventory.
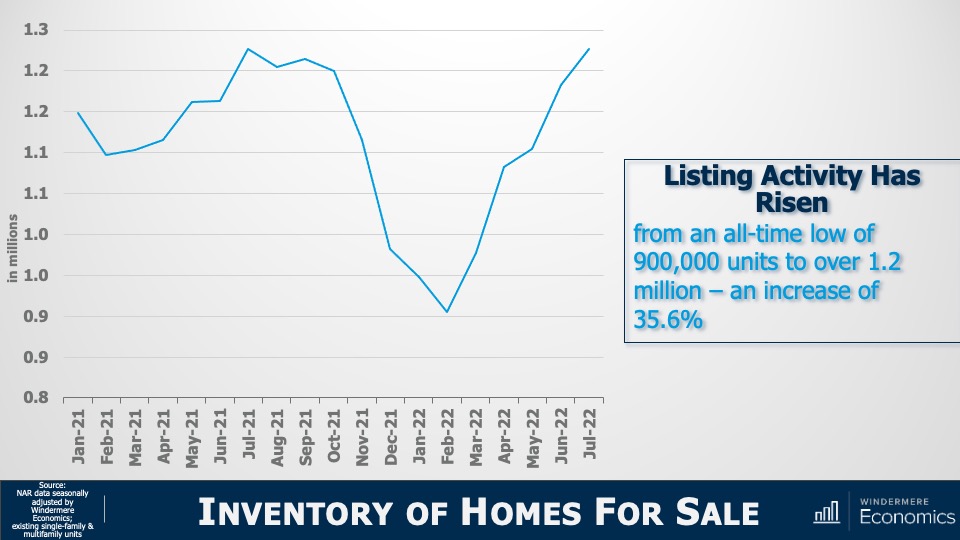
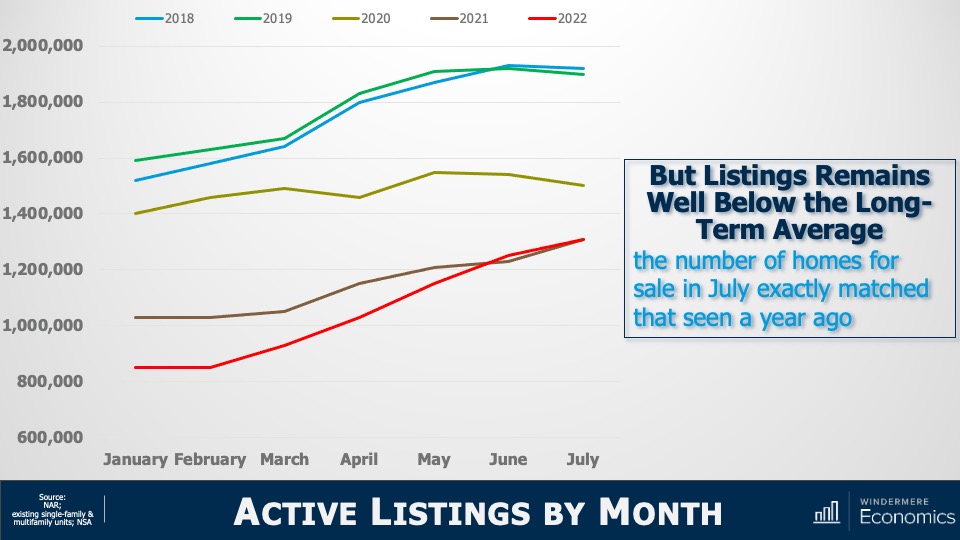
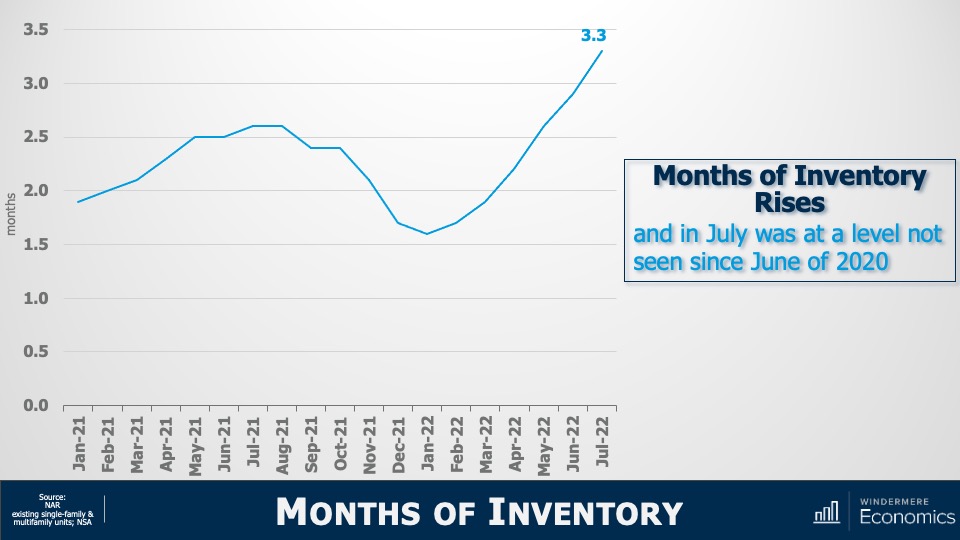
❱ Listing activity continues to be well below normal levels, with total available inventory 40.7% lower than a year ago, and 35.5% lower than in the fourth quarter of 2020.
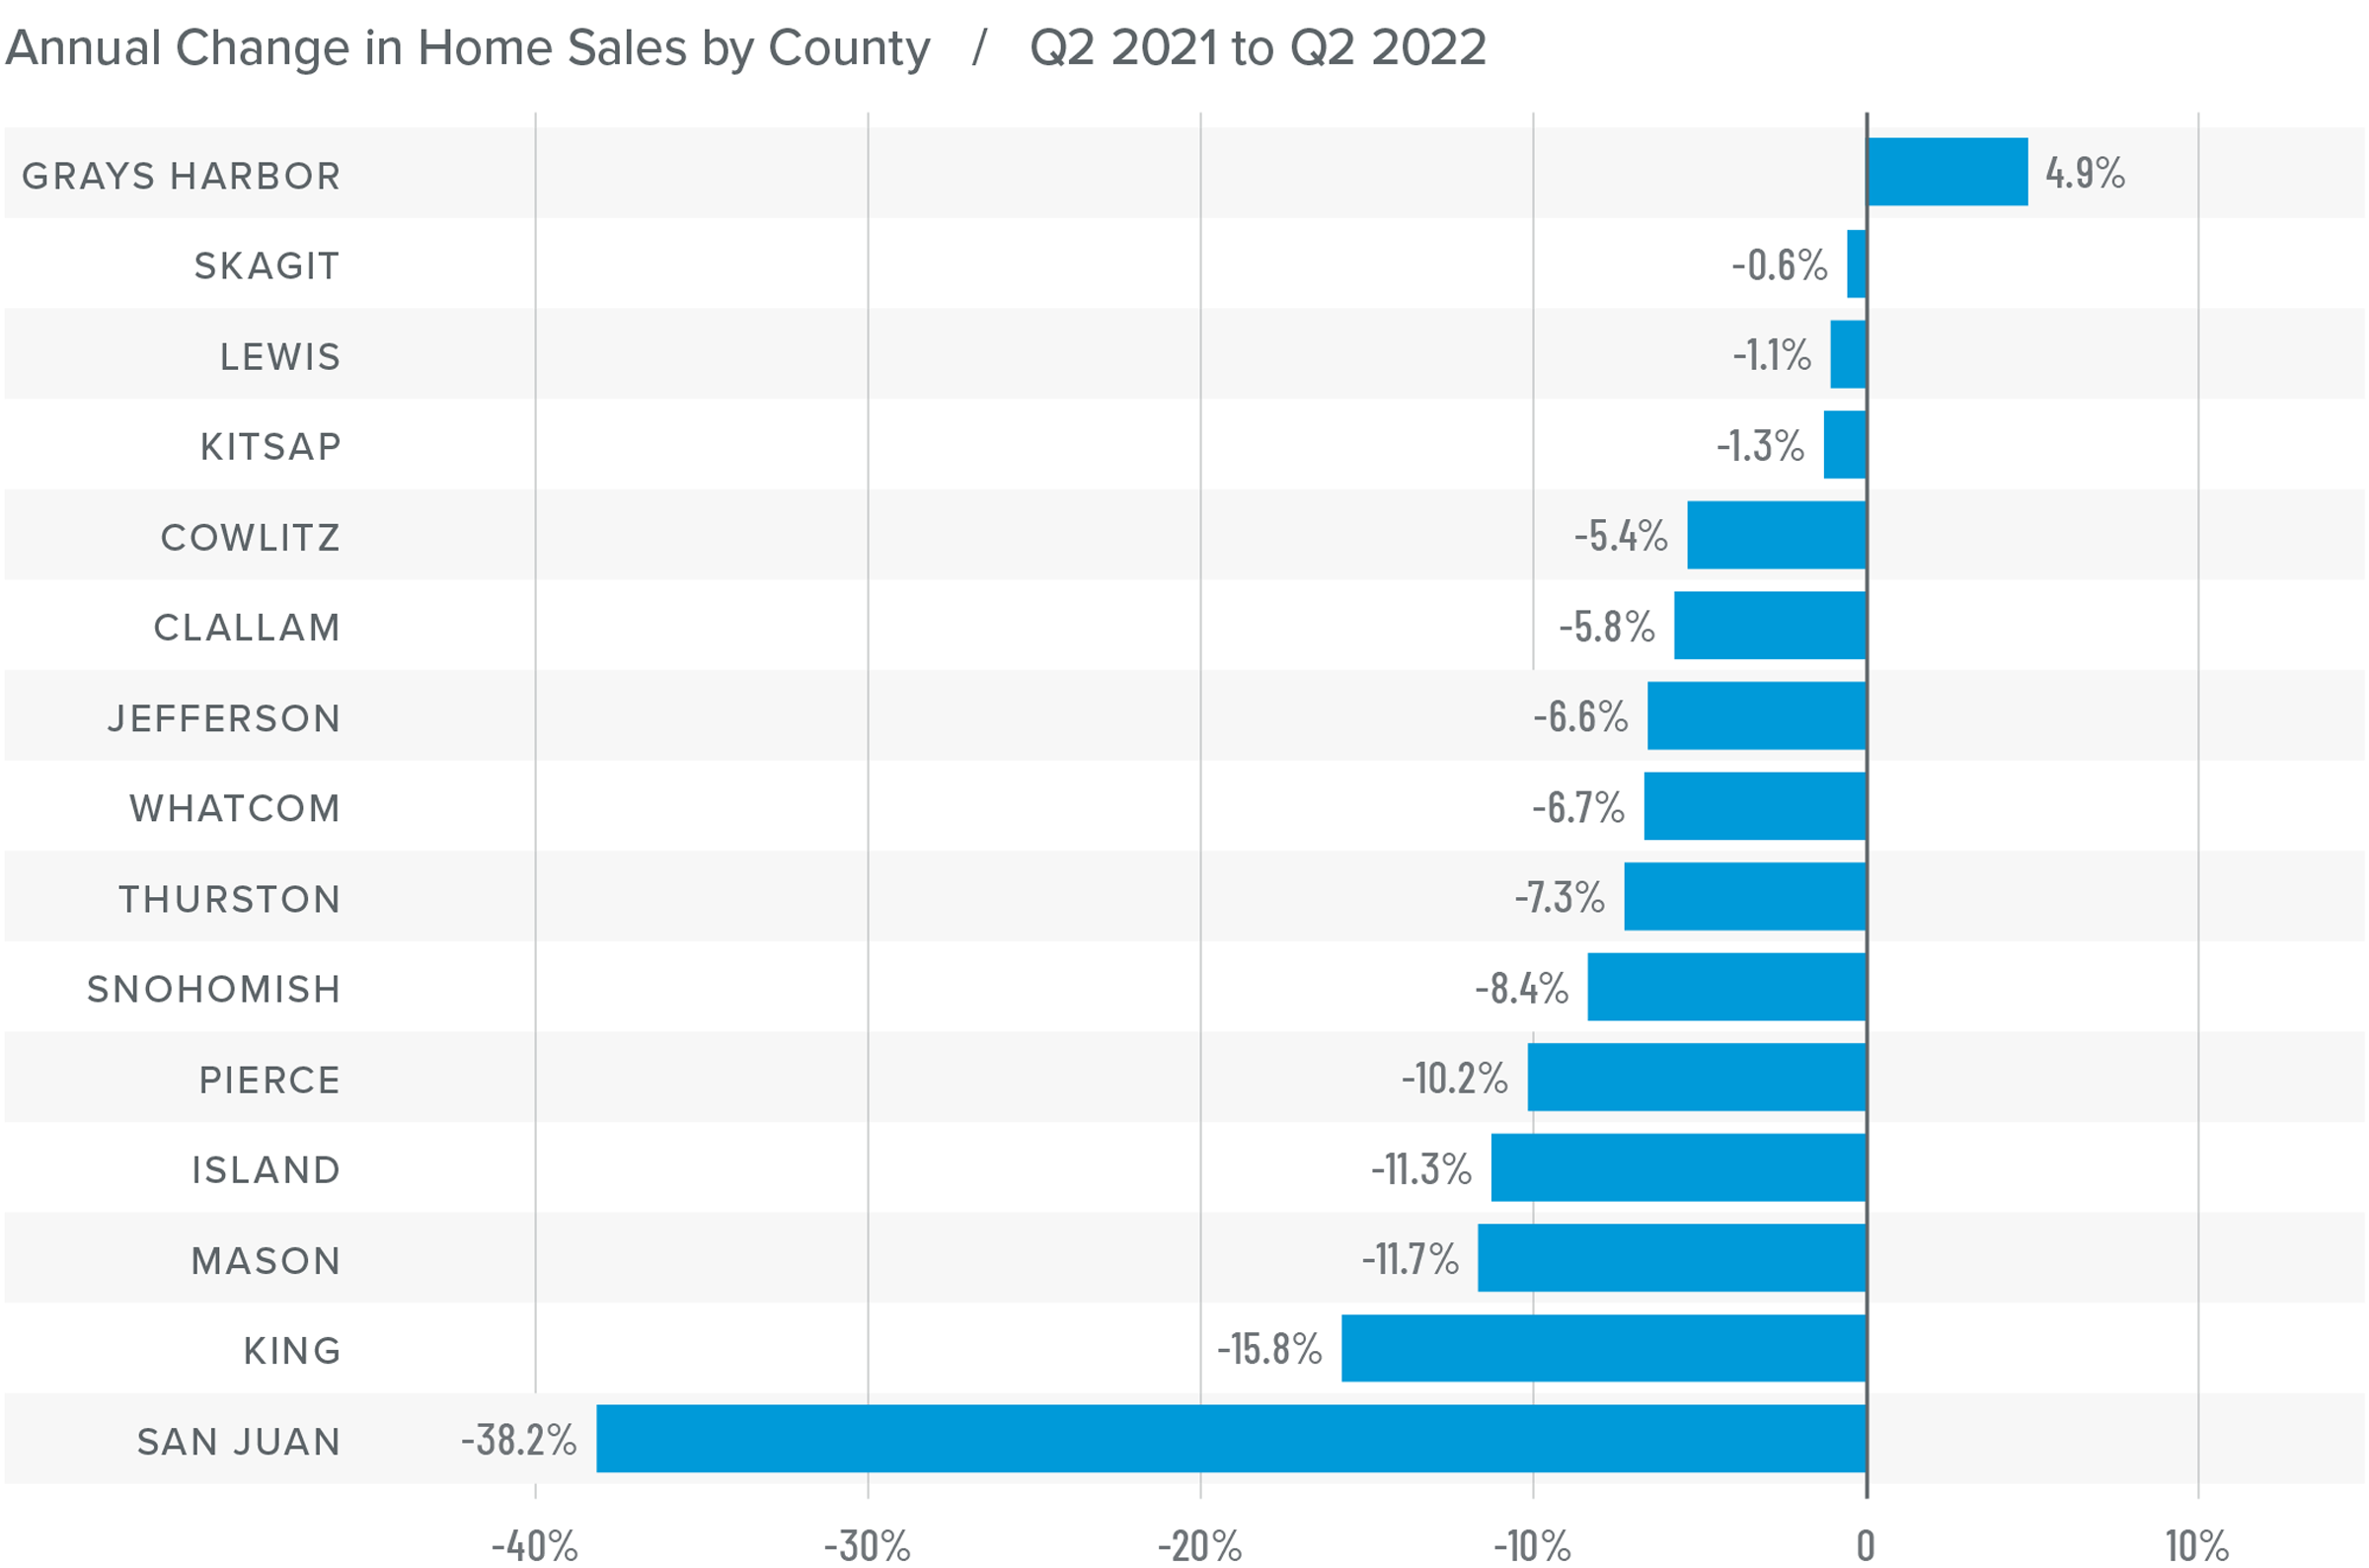
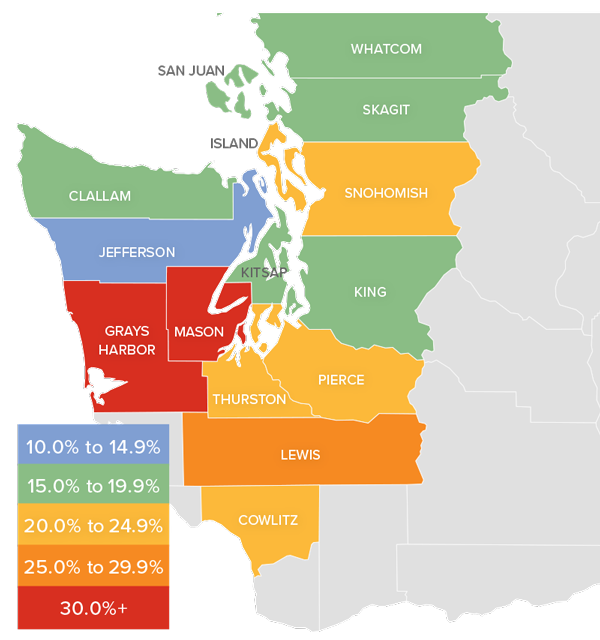
❱ Sales rose in all counties other than Jefferson, though the drop there was only one unit. There were significant increases in almost every other county, but sales growth was more muted in Cowlitz and Thurston counties. San Juan County again led the way, likely due to ongoing interest from second-home buyers.
❱ The ratio of pending sales (demand) to active listings (supply) shows how competitive the market is. Western Washington is showing pendings outpacing new listings by a factor of almost six to one. The housing market is as tight now as I have ever seen it.
WESTERN WASHINGTON HOME PRICES
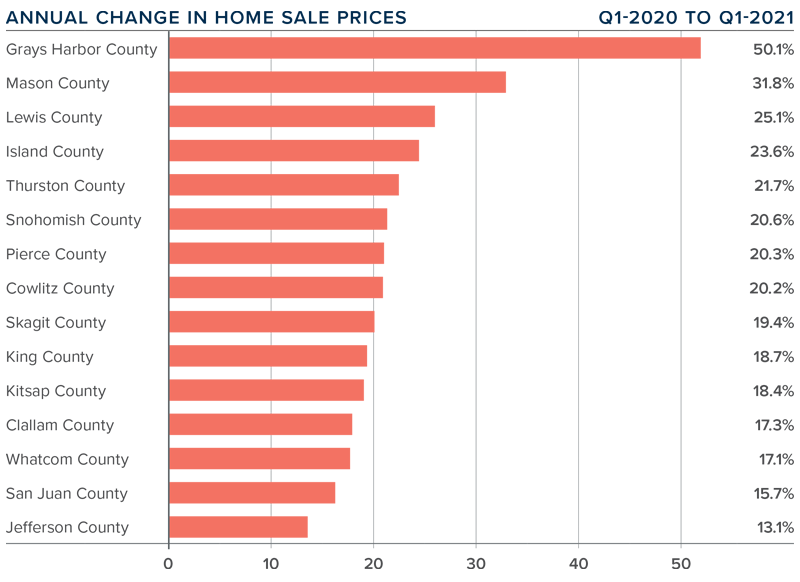
❱ Home price growth in Western Washington continues to trend well above the long-term average, with prices 21.3% higher than a year ago. The average home sale price was $635,079.
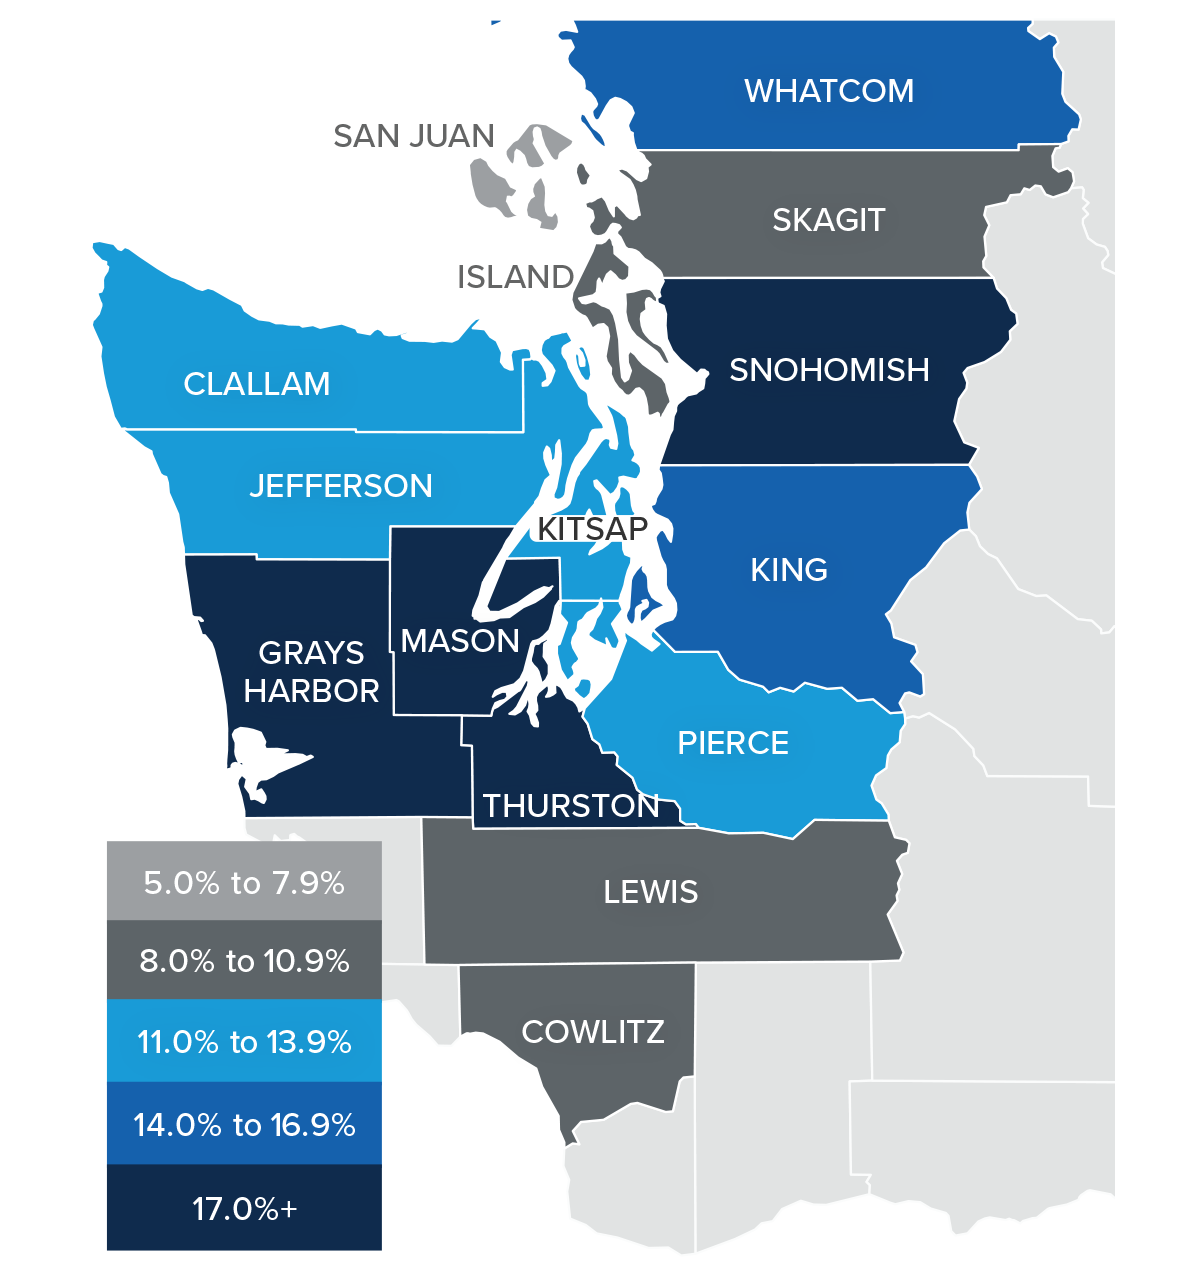
❱ Compared to the same period a year ago, price growth was strongest in Grays Harbor and Mason counties, but all markets saw double-digit price growth compared to a year ago.
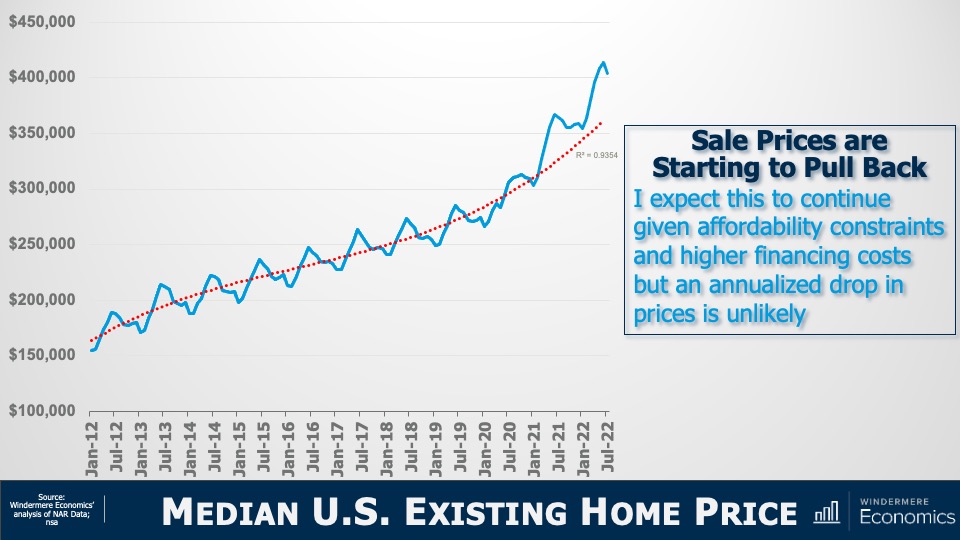
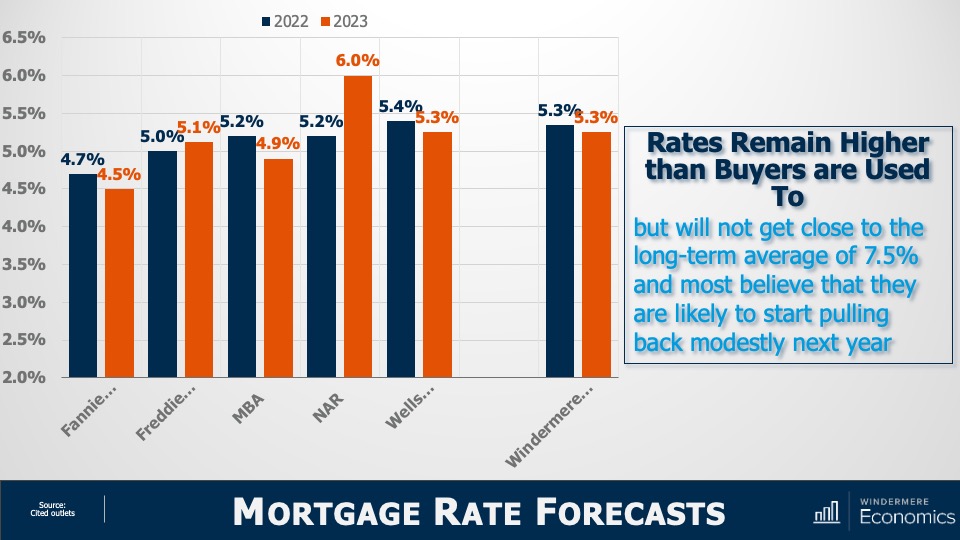
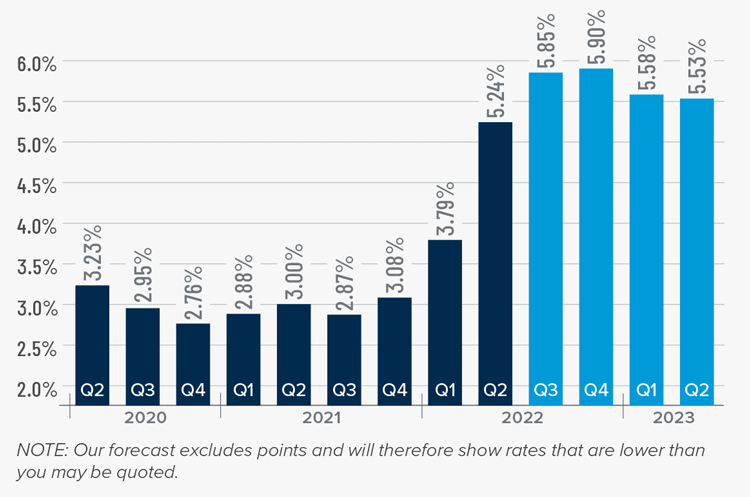
❱ Home prices were also 2.9% higher than in the final quarter of 2020, which was good to see given that 30-year mortgage rates rose .4% in the quarter.
❱ I expect to see mortgage rates continue to trend higher as we move through the year, but they will remain significantly lower than the long-term average. Any increase in rates can act as a headwind to home-price growth, but excessive demand will likely cause prices to continue to rise.
DAYS ON MARKET
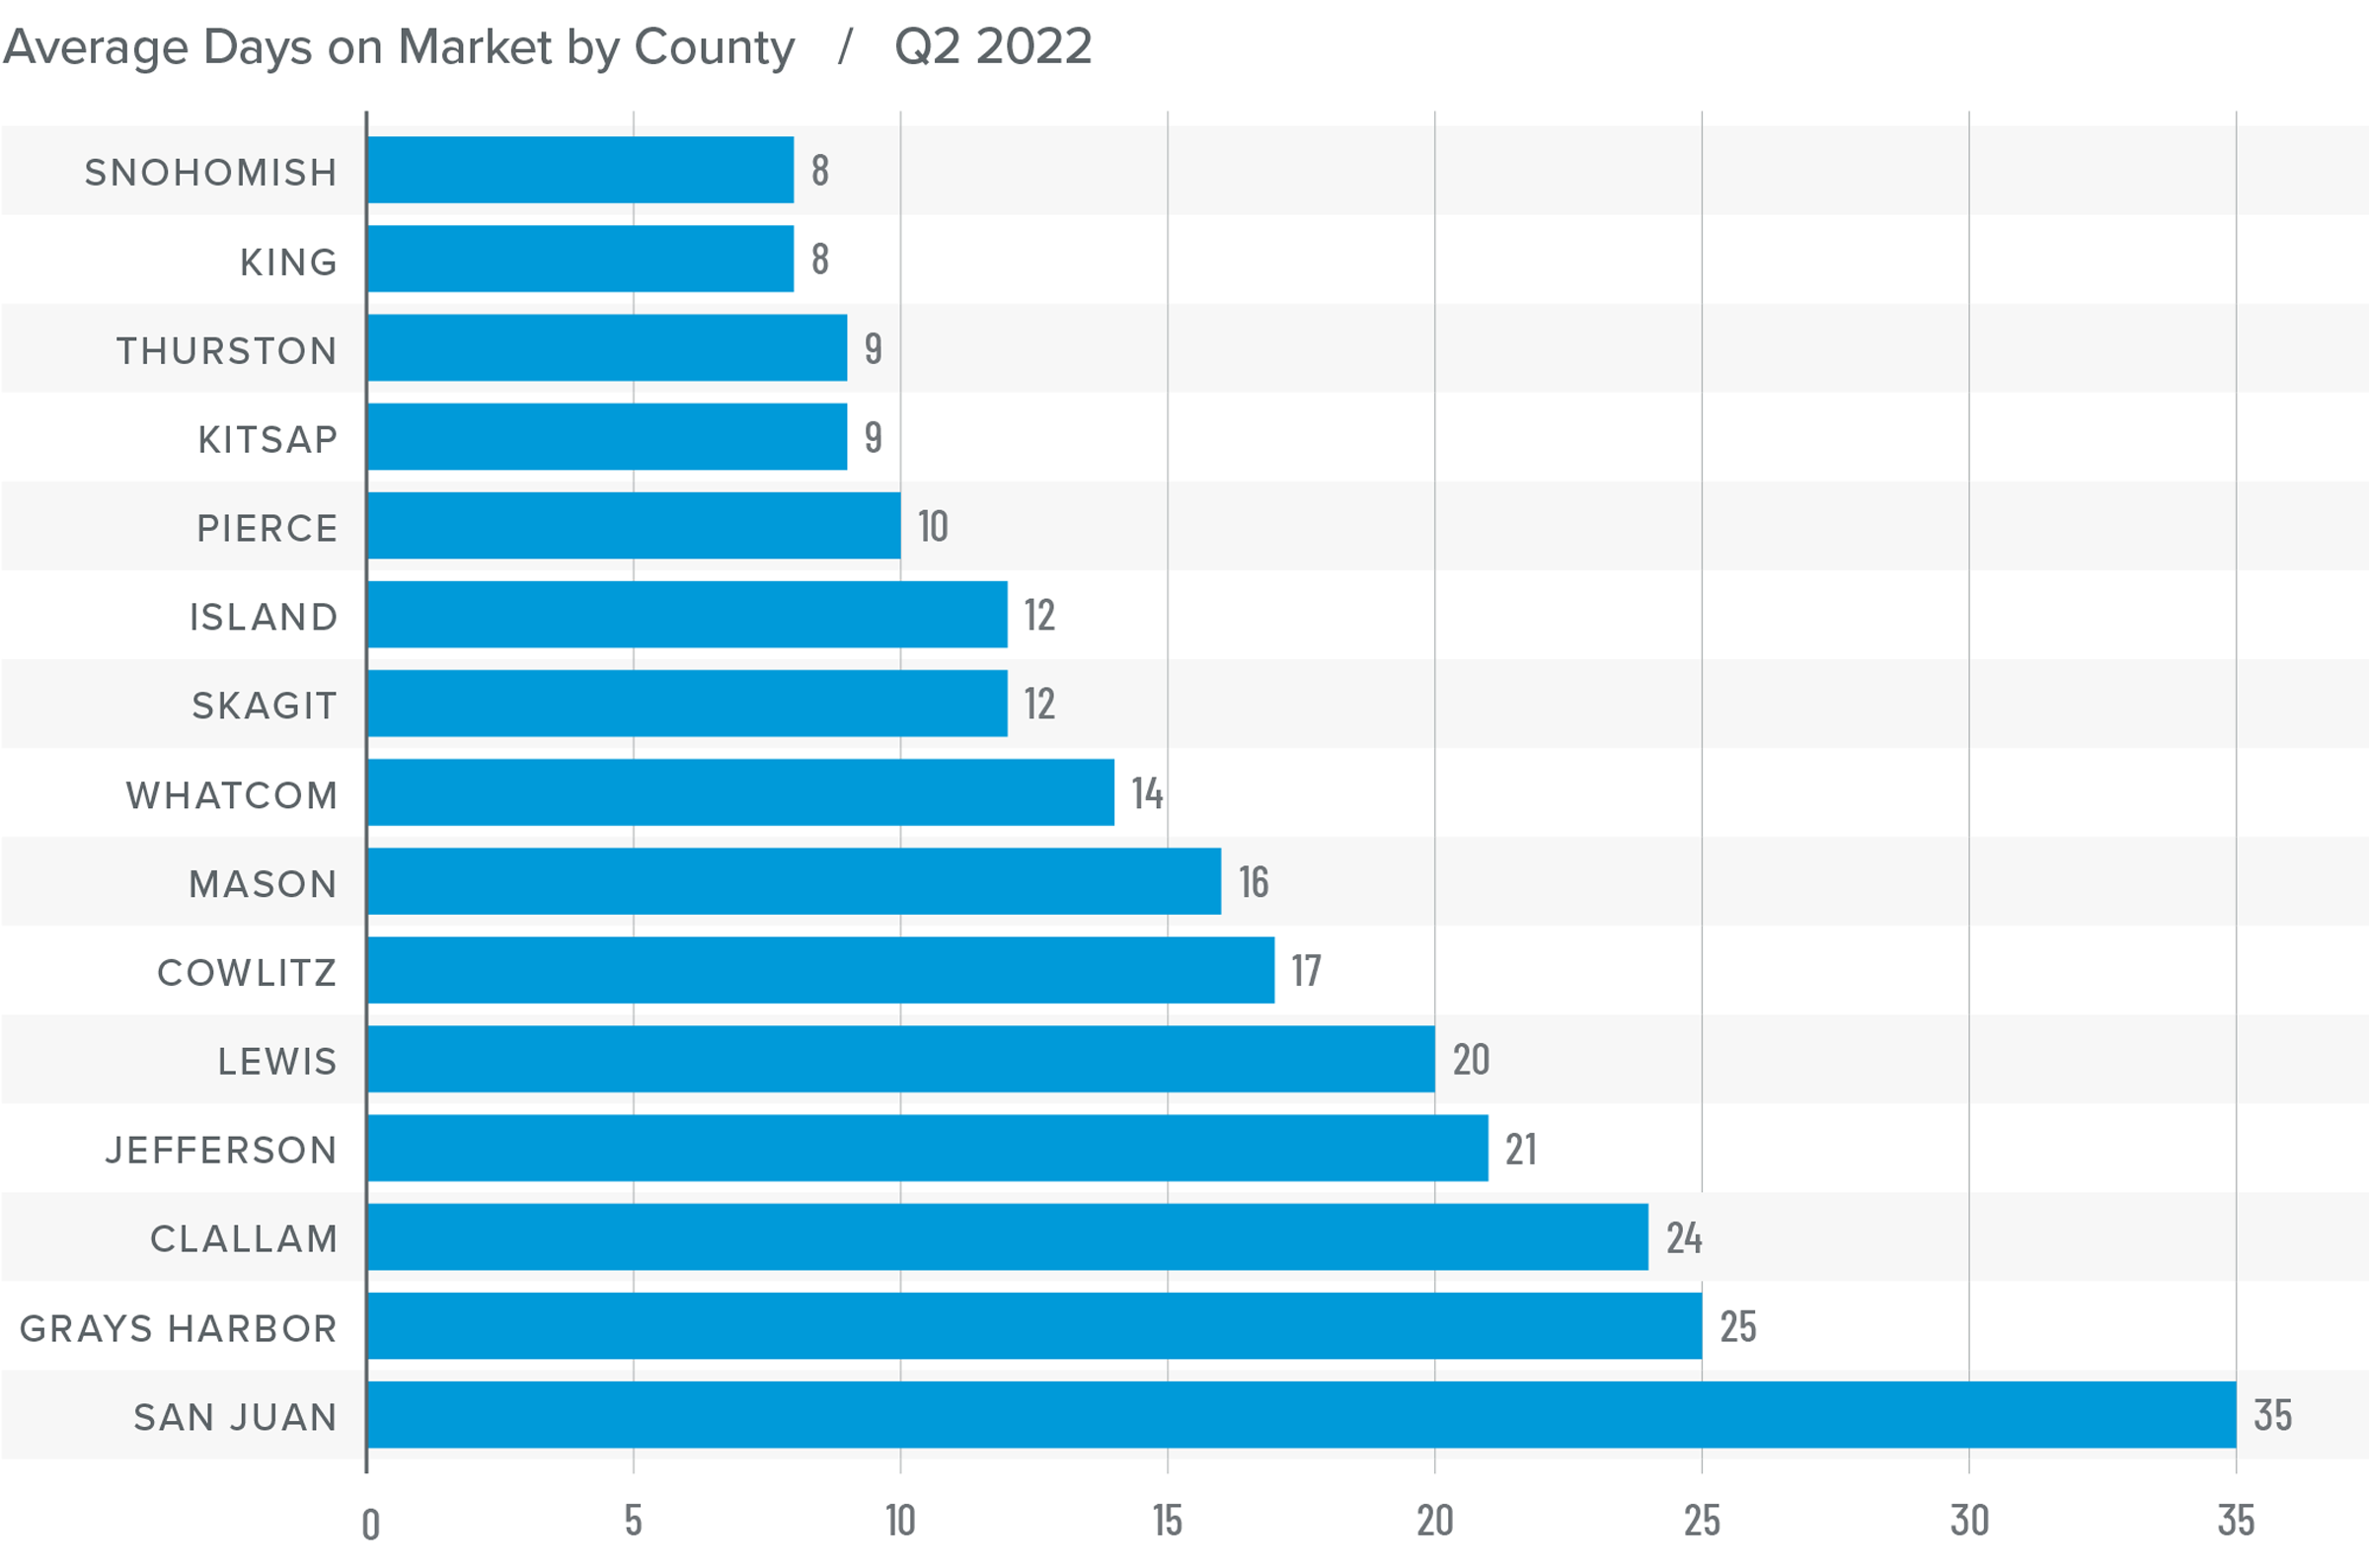
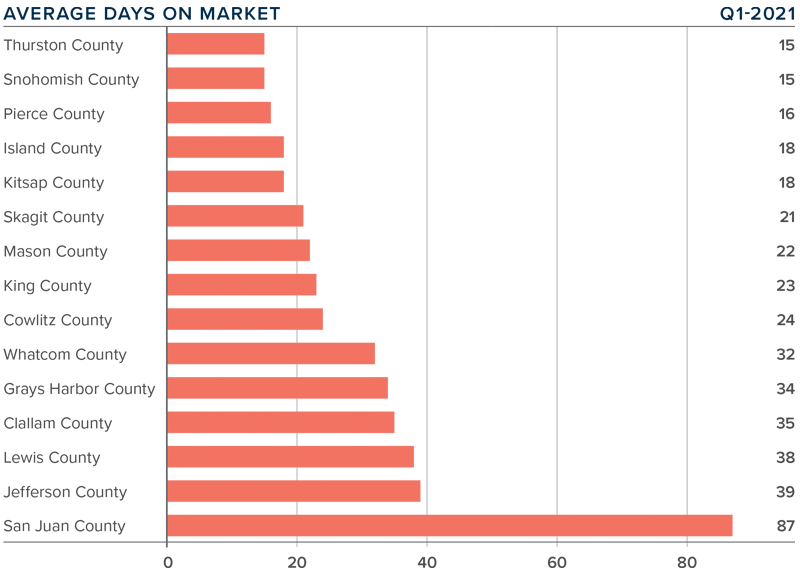
❱ The market in early 2021 continued to show far more demand than supply, which pushed the average time it took to sell a home down 25 days compared to a year ago. It took 2 fewer days to sell a home than it did in the final quarter of 2020.
❱ Snohomish and Thurston counties were the tightest markets in Western Washington, with homes taking an average of only 15 days to sell. The greatest drop in market time was in San Juan County, where it took 52 fewer days to sell a home than it did a year ago.
❱ Across the region, it took an average of only 29 days to sell a home in the quarter. All counties saw market time decrease from the first quarter of 2020.
❱ Very significant demand, in concert with woefully low levels of supply, continues to make the region’s housing market very competitive. This will continue to be a frustration for buyers.
CONCLUSIONS
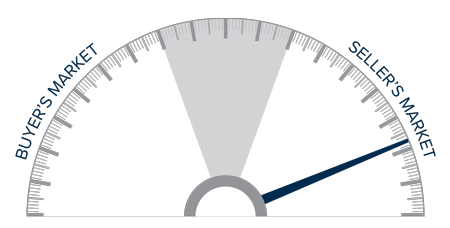
This speedometer reflects the state of the region’s real estate market using housing inventory, price gains, home sales, interest rates, and larger economic factors.
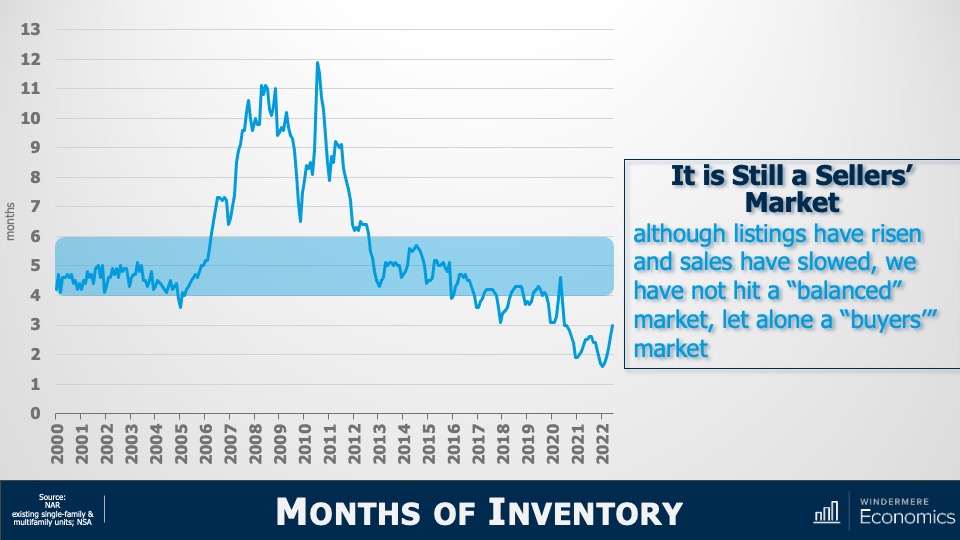
Demand is very strong and, even in the face of rising mortgage rates, buyers are still out in force. With supply still lagging significantly, it staunchly remains a seller’s market. As such, I am moving the needle even further in their favor.
As I mentioned in last quarter’s Gardner Report, 2021 will likely see more homeowners make the choice to sell and move if they’re allowed to continue working remotely. On the one hand, this is good for buyers because it means more listings to choose from. However, if those sellers move away from the more expensive core markets into areas where housing is cheaper, it could lead to increased competition and affordability issues for the local buyers in those markets.
ABOUT MATTHEW GARDNER

As Chief Economist for Windermere Real Estate, Matthew Gardner is responsible for analyzing and interpreting economic data and its impact on the real estate market on both a local and national level. Matthew has over 30 years of professional experience both in the U.S. and U.K.
In addition to his day-to-day responsibilities, Matthew sits on the Washington State Governors Council of Economic Advisors; chairs the Board of Trustees at the Washington Center for Real Estate Research at the University of Washington; and is an Advisory Board Member at the Runstad Center for Real Estate Studies at the University of Washington where he also lectures in real estate economics.
This post originally appeared on the Windermere.com blog
Neither the snowstorm nor the increase in mortgage rates dampened buyer demand in February. Lack of inventory continues to be a frustration as there are way more prospective buyers than there are homes for them to buy. As a result, prices continued their upward climb.
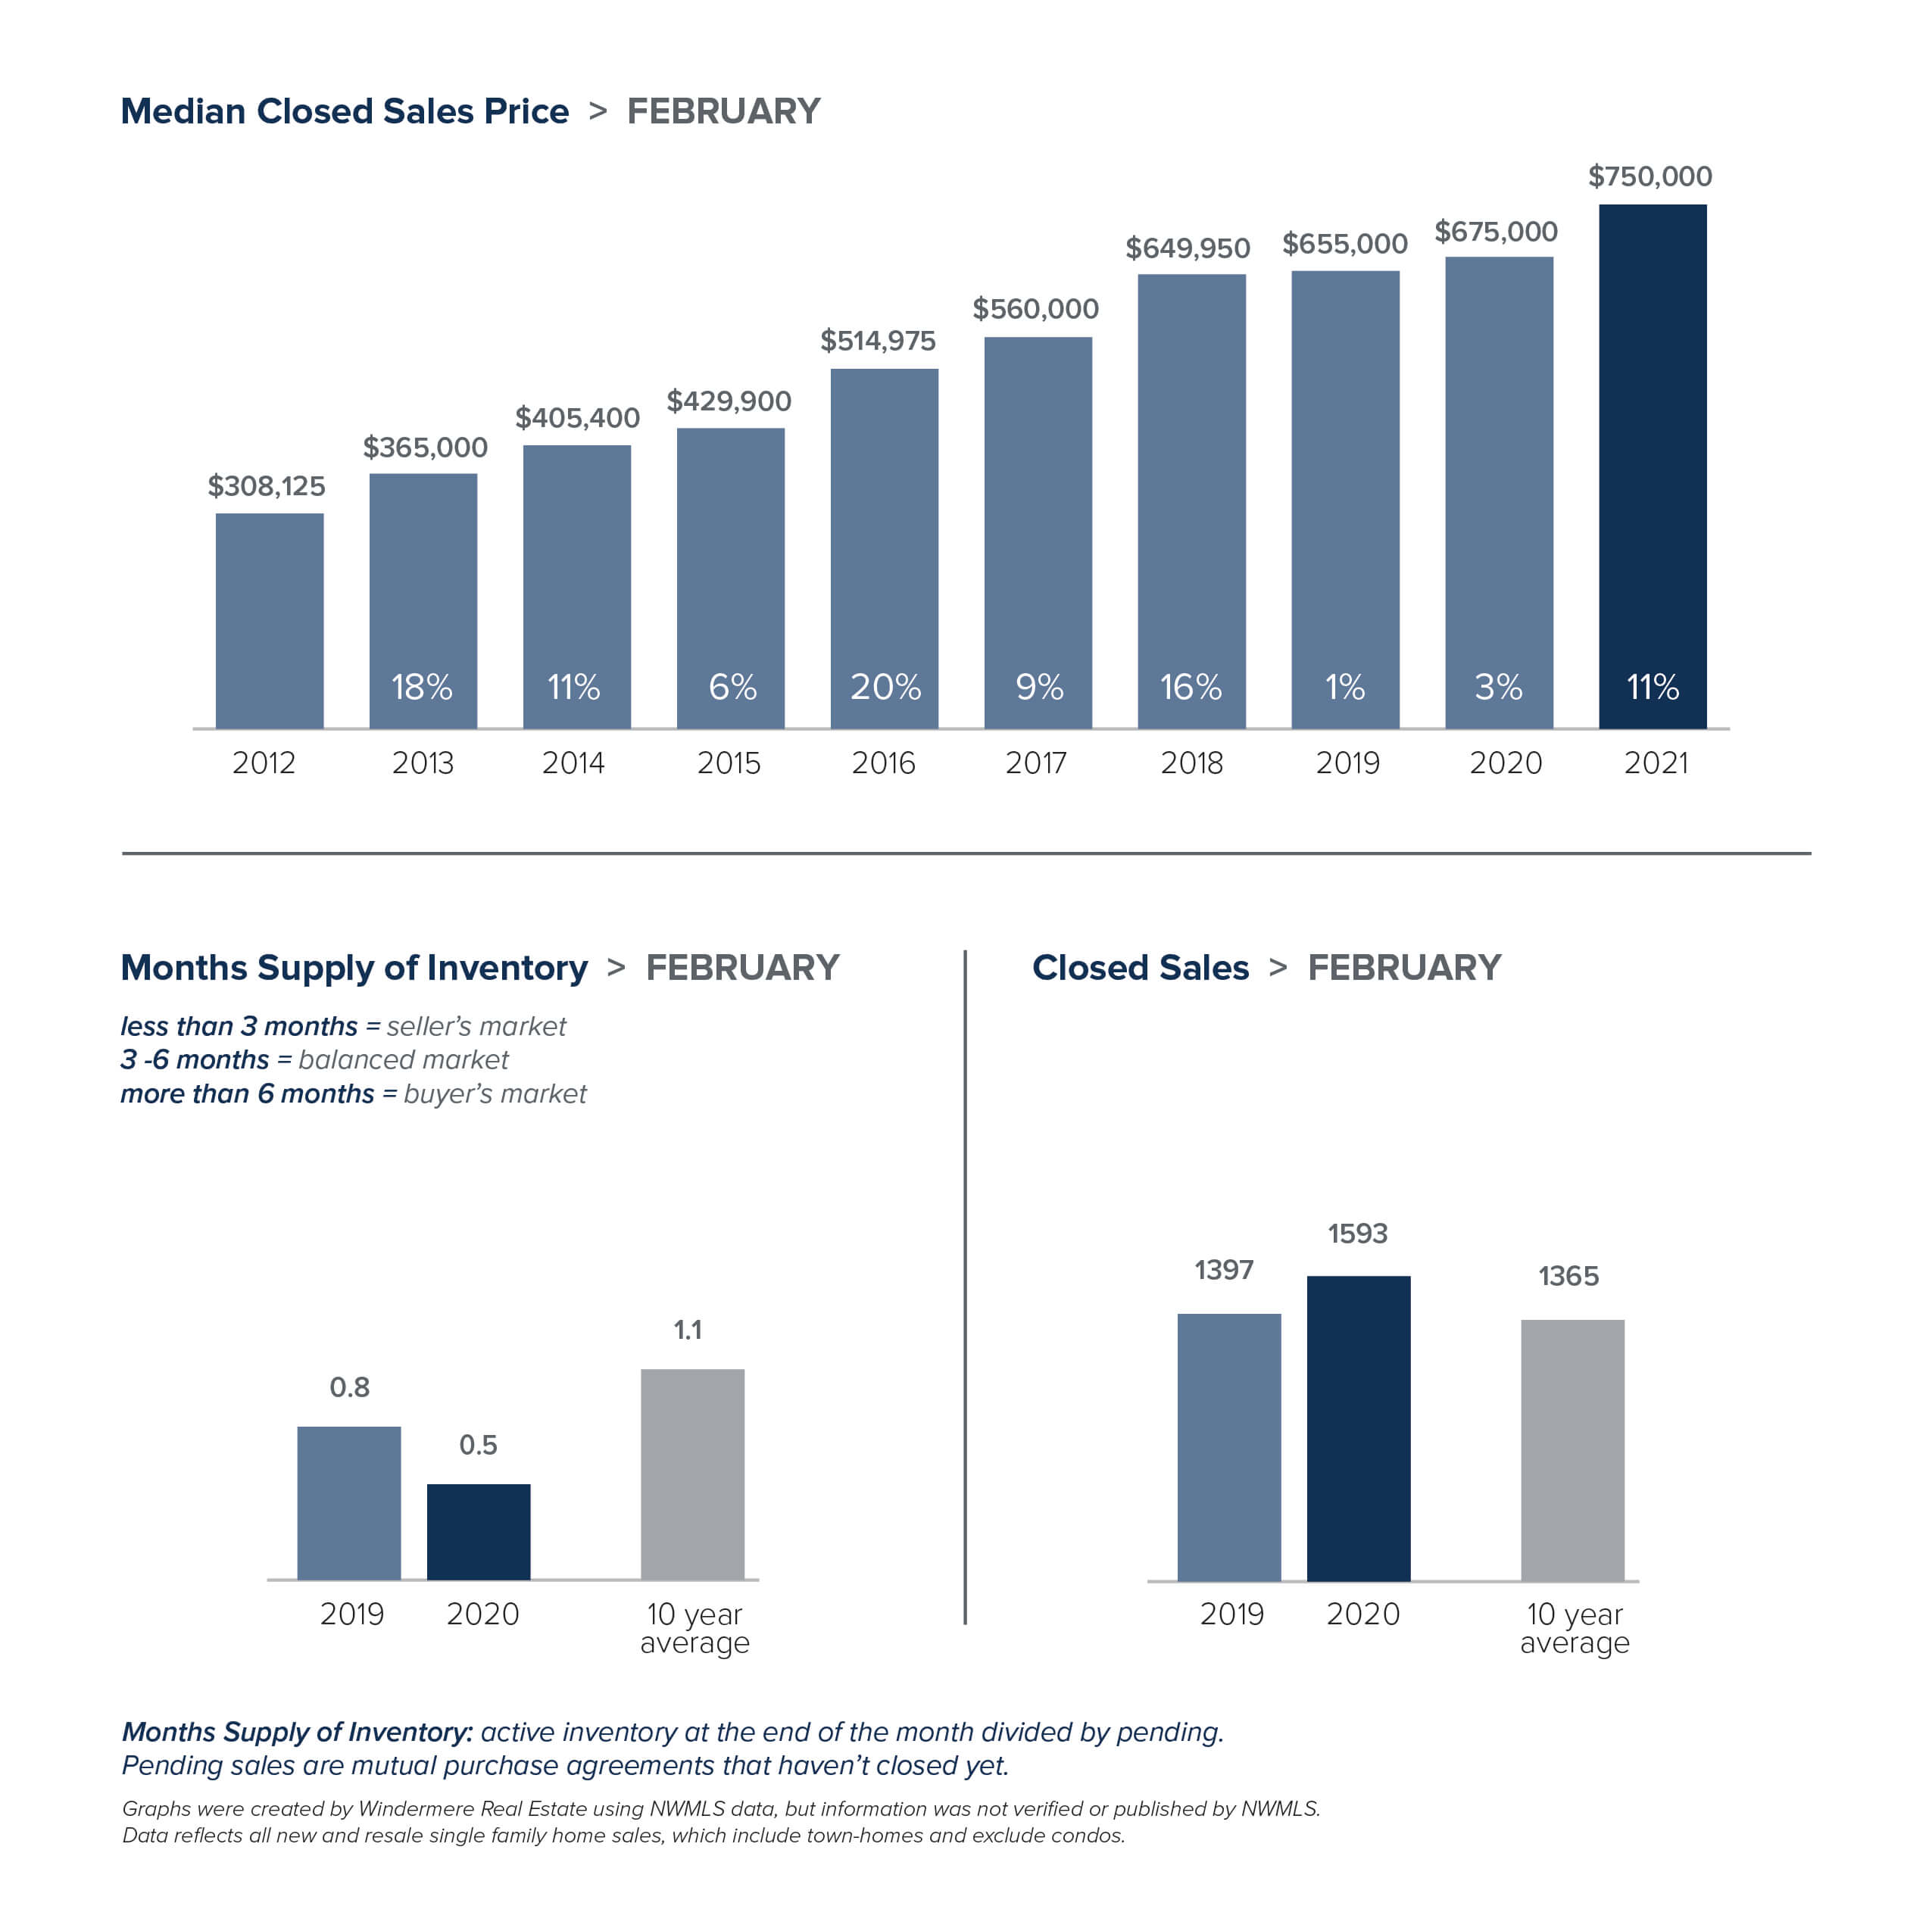
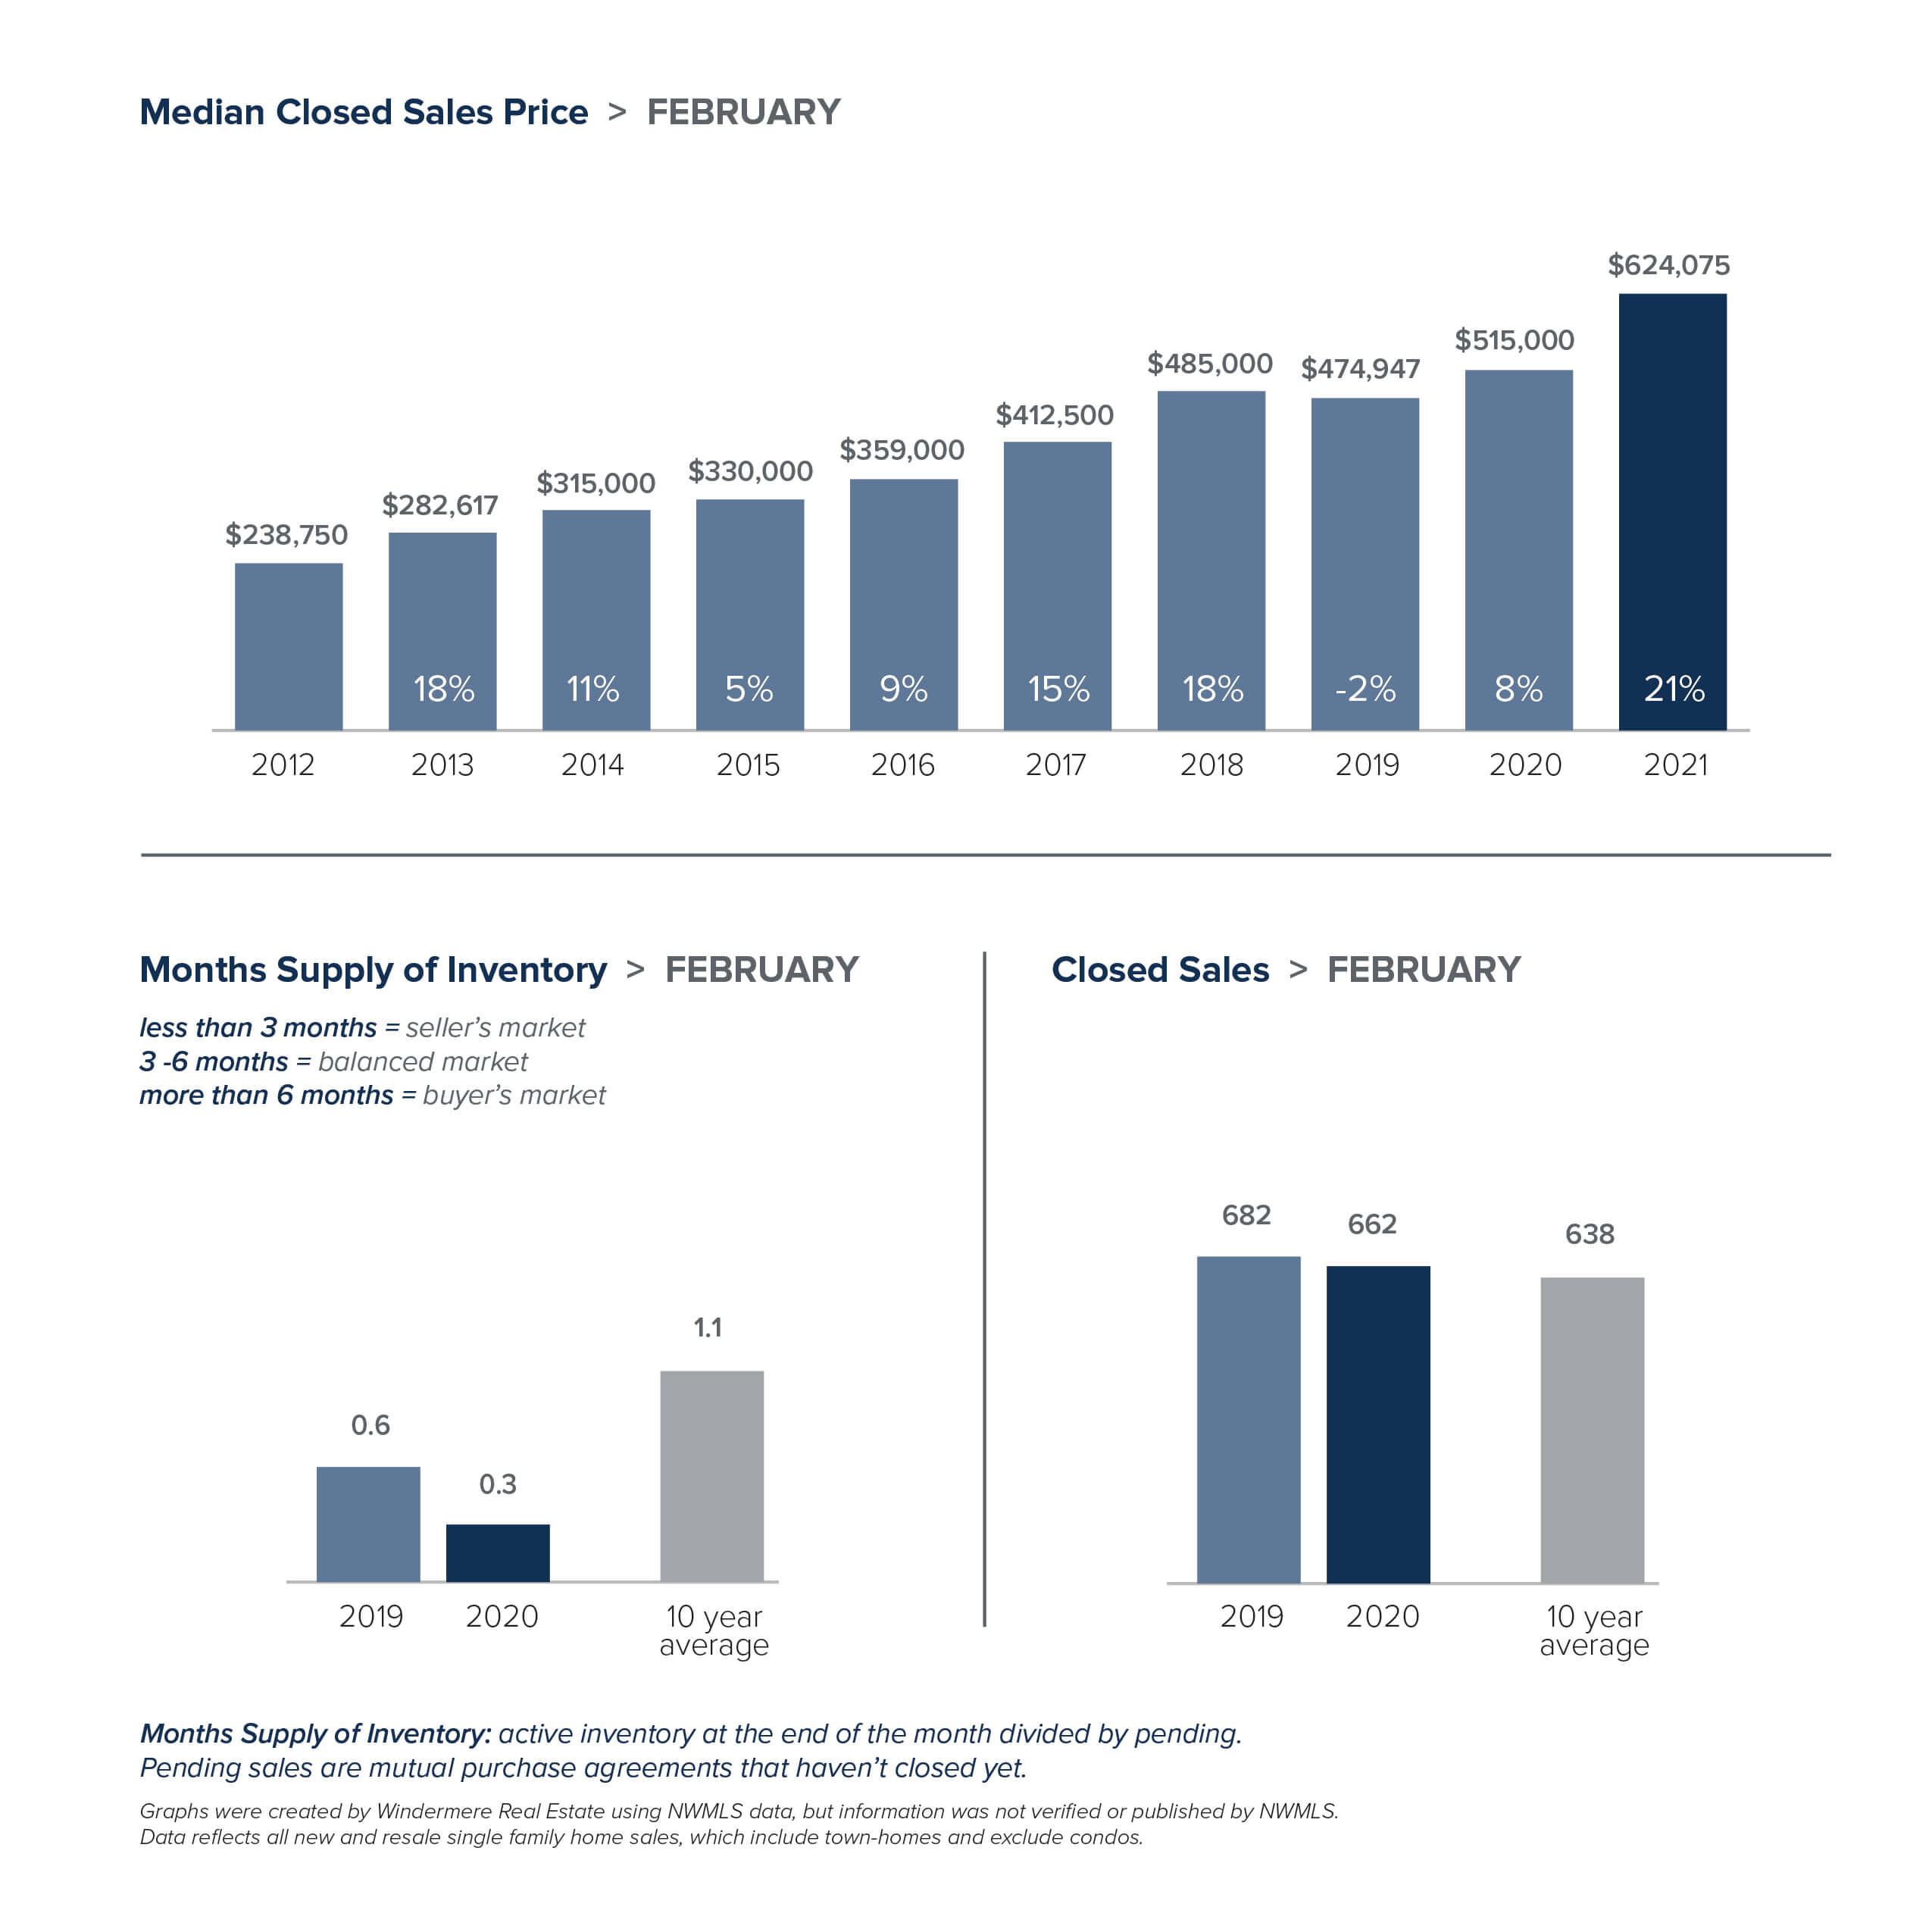
While the number of homes for sale edged up, it was still far shy of demand. This is especially true of single-family homes. There were 41% fewer homes on the market in King County in February than the same time last year. In an indication of just how competitive the current market is, the entire Eastside ended the month with just 224 homes for sale. Inventory was even more scarce in Snohomish County where the entire county had just 283 homes for sale, a drop of 58% from a year ago. Condo shoppers have more options as the number of units on the market in King County increased 56% from last February.
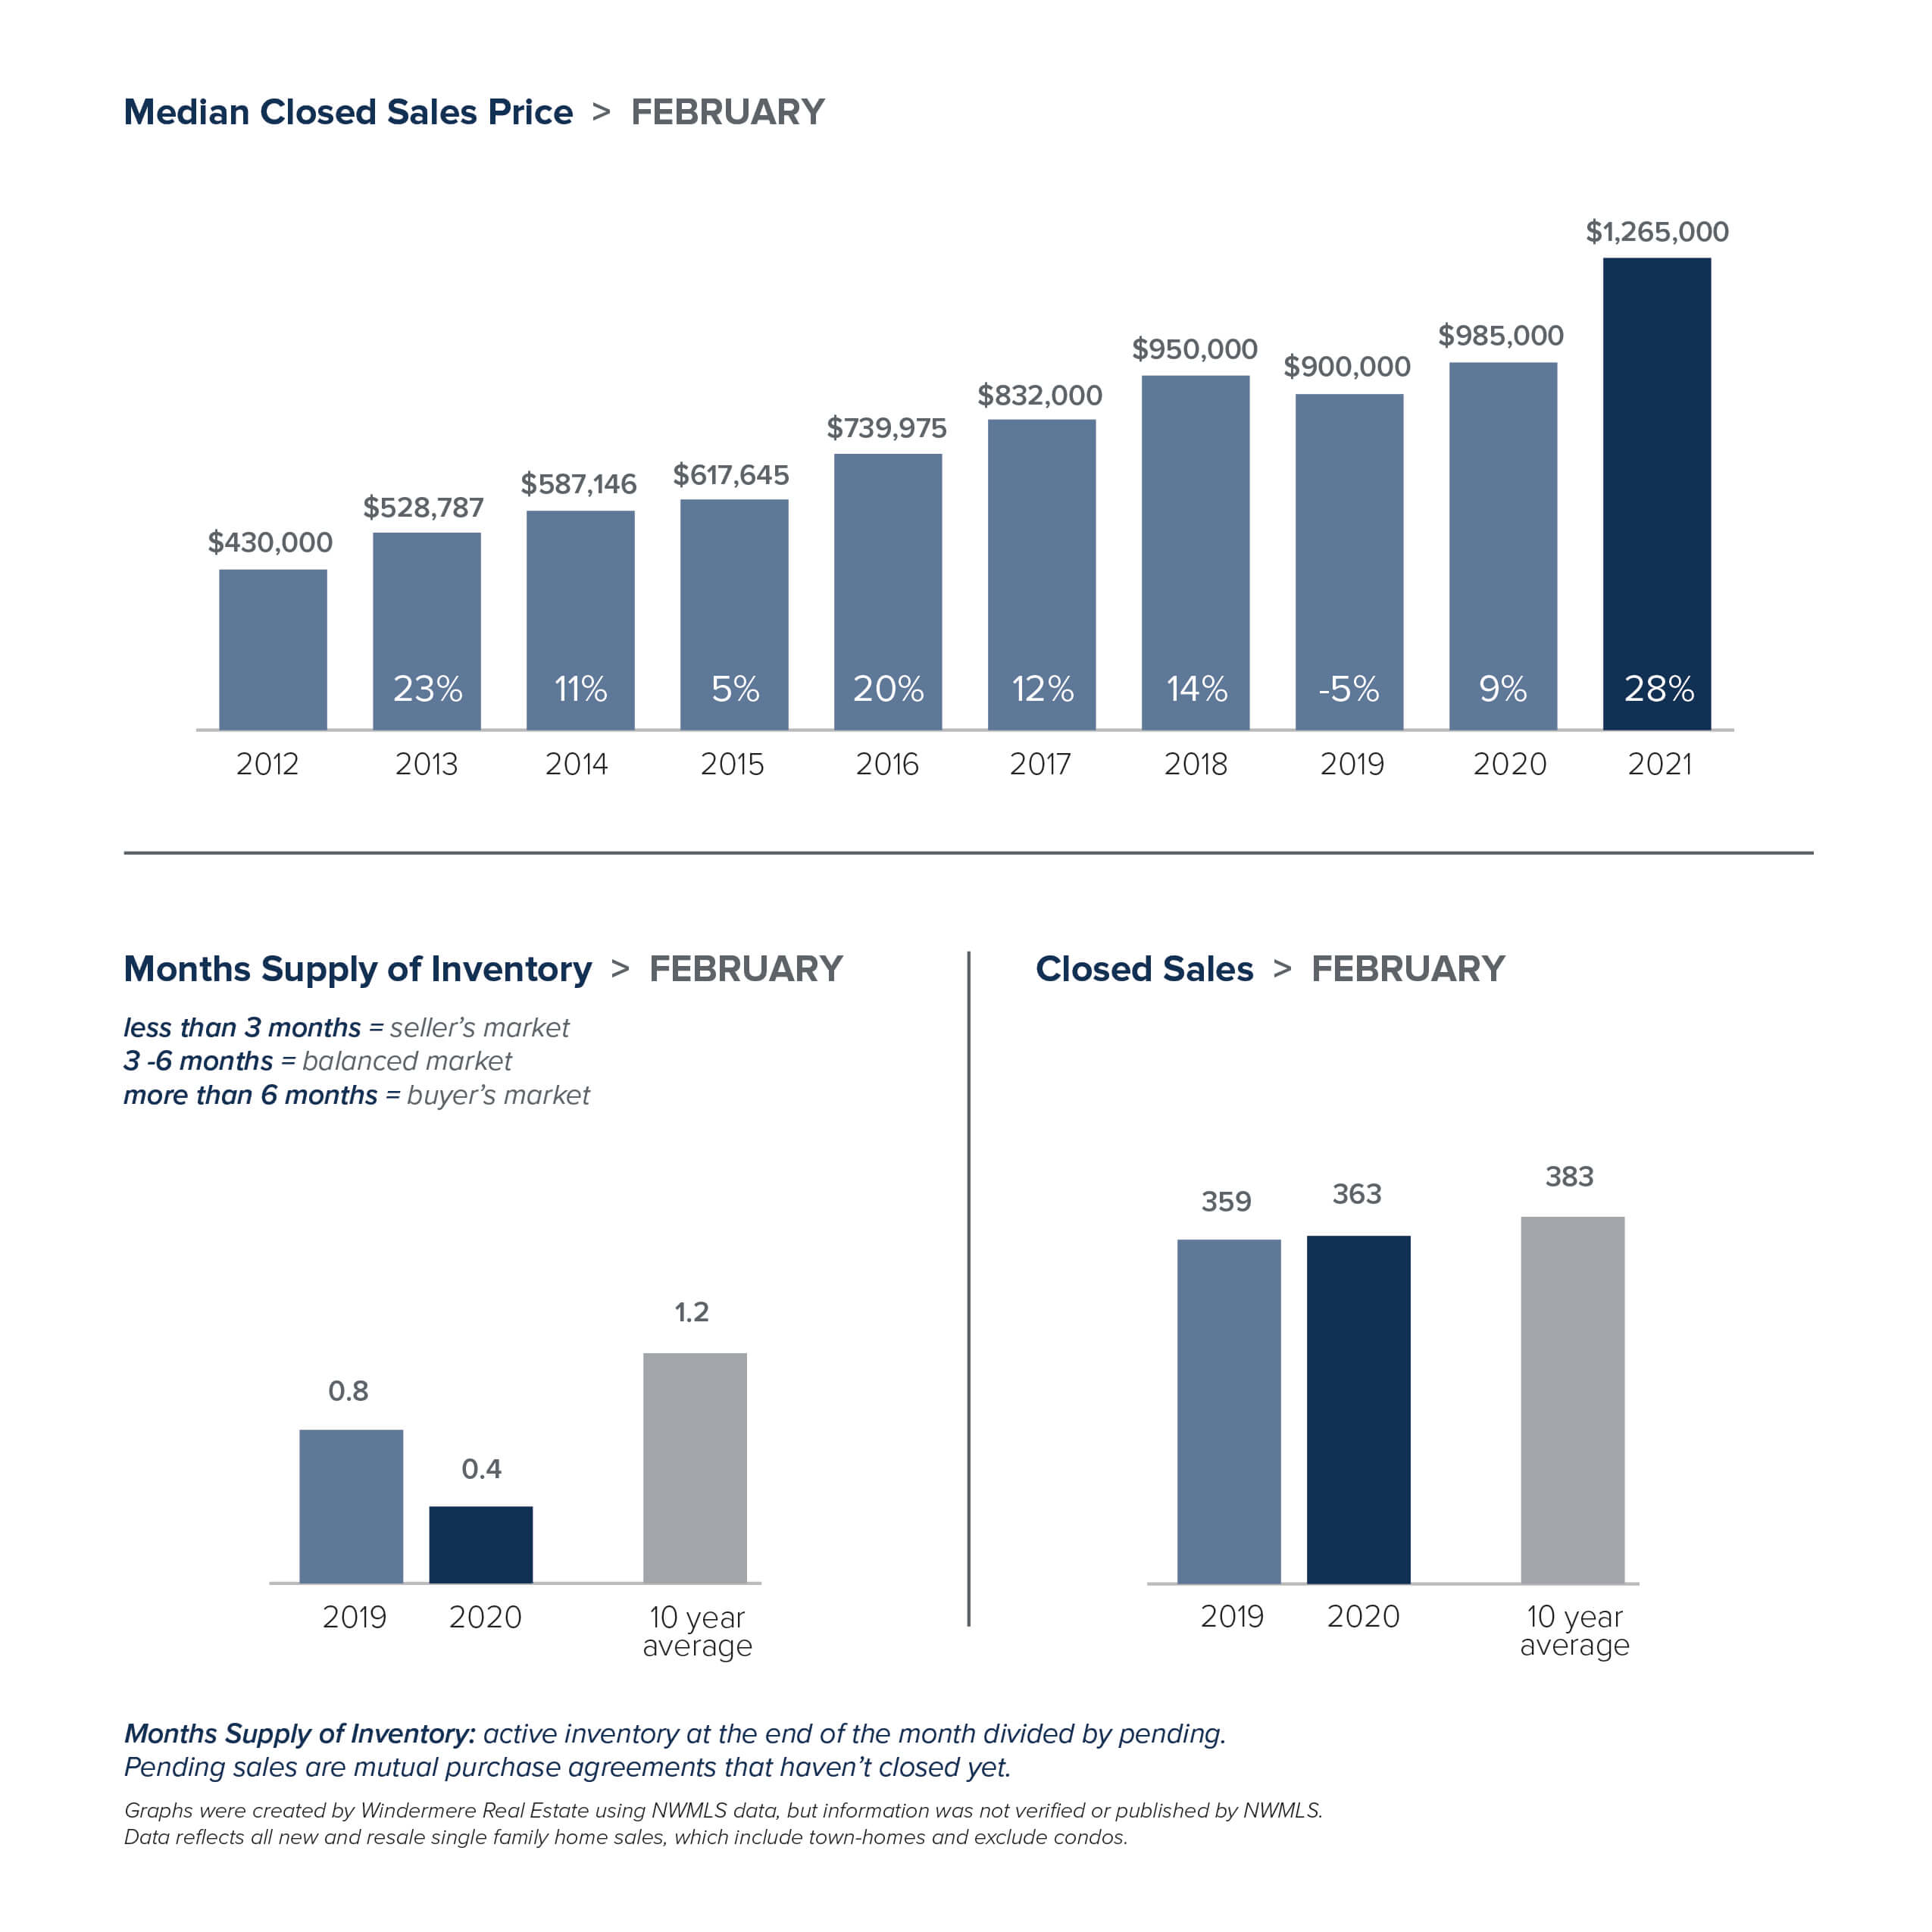
With inventory so slim, competition is fierce. 57% of King County properties that sold in February sold over the list price. The median sale price paid was 9% over list price. Both are record highs. Competition doesn’t show signs of easing any time soon. A hike in interest rates is expected to only increase buyer urgency. An average rate of 3.02% for a 30-year fixed-rate mortgage for the week ending March 4 is the first time since July that the benchmark mortgage rate climbed above 3%.
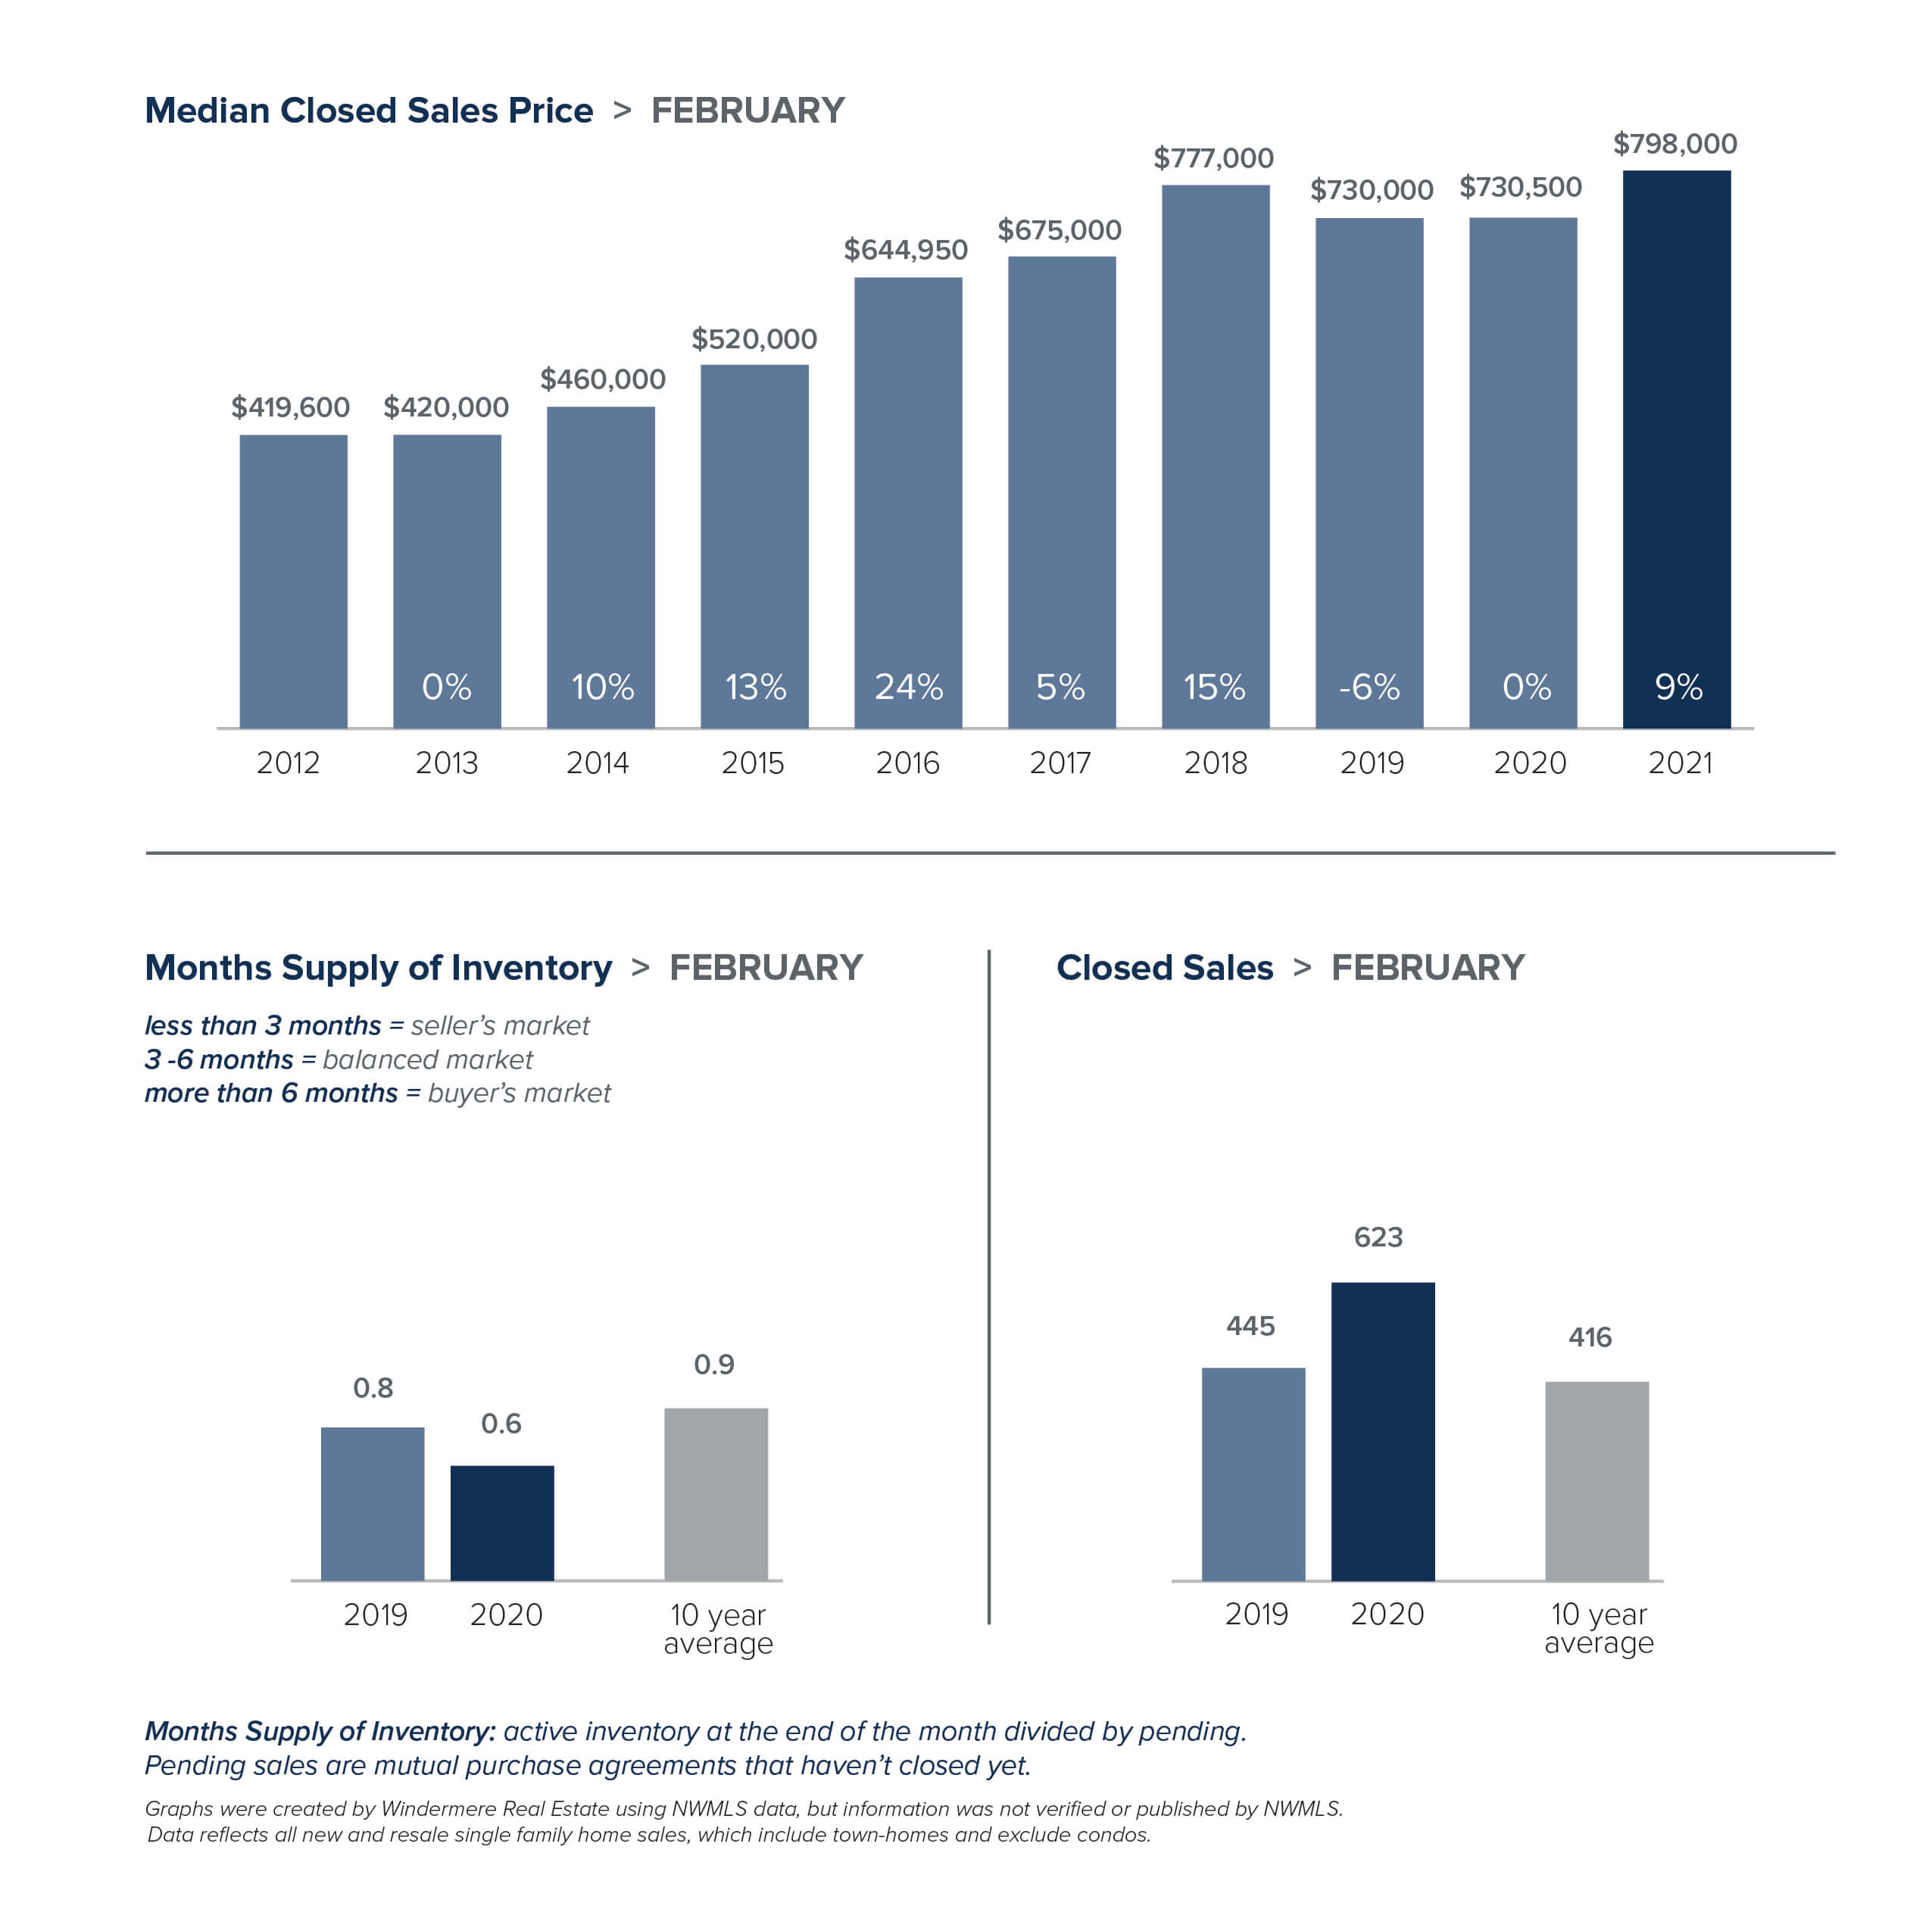
The enormous imbalance between supply and demand sent single-family homes prices soaring throughout the region. In King County, the median home sold for $750,000, 11% higher than a year ago. Most areas in the county saw double-digit increases. Home prices on the Eastside jumped a whopping 28%. Seattle home prices were up 9%. In Snohomish County, the February $624,075 median price was up 21% from a year earlier and far surpassed the previous all-time high of $599,990 set in January.
With seller review dates, escalation clauses and multiple offers now the norm it’s more important than ever for buyers to work with their broker to create a strategy that balances their wants and needs with their budget.
The charts below provide a brief overview of market activity. If you are interested in more information, every Monday Windermere Chief Economist Matthew Gardner provides an update on the US economy and housing market. You can get Matthew’s latest update here.